• 15-year lease with 4 (5-year) options to extend, demonstrating their commitment to the site
• The lease is corporate guaranteed by O’Reilly Automotive Stores, Inc., an investment grade (S&P: BBB), nationally recognized, and established auto parts store with over 5,500+ locations
• The lease features a 6% rental increase in Lease Year 11 and at the beginning of each option period, growing NOI and hedging against inflation
• Tenant pays for CAM, taxes, and insurance
• Landlord responsibilities limited to roof, structure, parking lot
• Ideal, low-management investment for a passive investor
Location
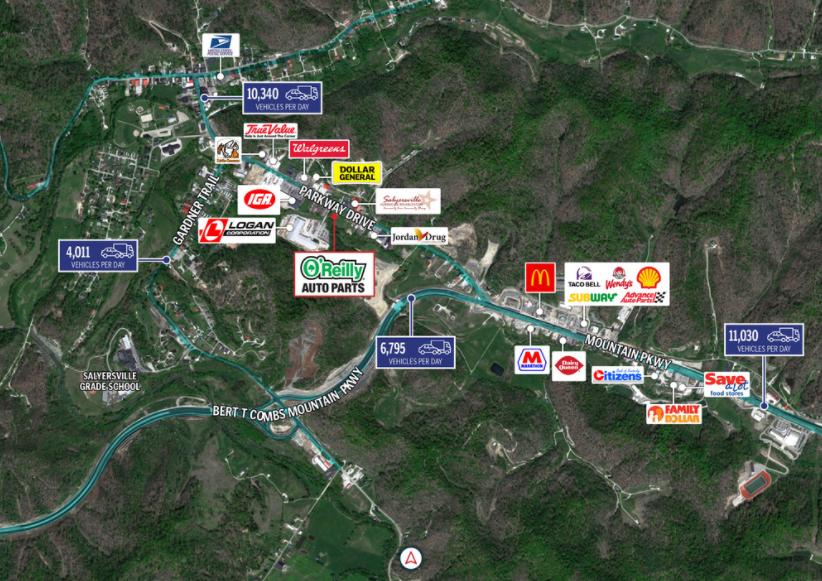
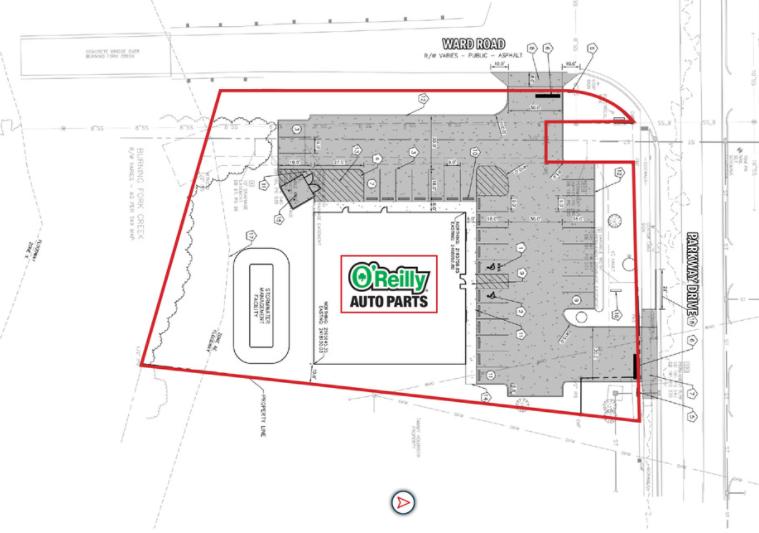
• O’Reilly Auto Parts is located at the hard corner intersection of Ward Road and Parkway Drive, the primary retail and commuter thoroughfare serving the Salyersville trade area
• Directly in front of Logan Corporation, a diversified company that manufactures and supplies a wide range of quality products for automotive, construction, mining, and rail transportation
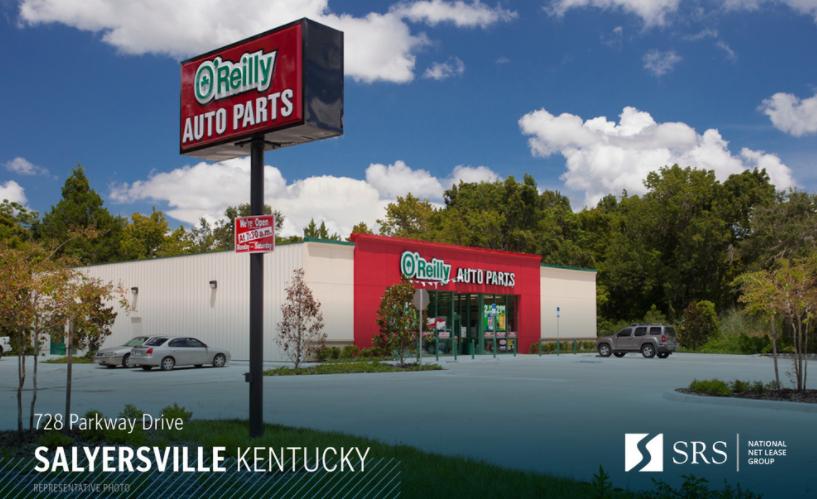
• Brand new construction that features high-quality construction and distinct design elements
• The site is equipped with a large monument sign, creating excellent visibility along Parkway drive
No part of this information may be copied, reproduced, repurposed, or screen-captured for any commercial purpose without prior written authorization from MyEListing.
While we strive to provide the most accurate information, all listing information, and demographic data, is provided by third-parties. As such, MyEListing will not be responsible for the accuracy of the information. It is strongly recommended that you verify all information with the listing agent, and any relevant agencies, prior to making any decisions.
What is the asking price for 728 Parkway Drive in Salyersville?
The asking price for 728 Parkway Drive is $1,961,000
What is the building size of this Retail property in Salyersville, KY?
The size of the building/unit at 728 Parkway Drive in Salyersville is 7,225 square feet
What kind of Retail is the propery at 728 Parkway Drive?
The property at 728 Parkway Drive Salyersville, KY 41465 is listed as a Free Standing Building Retail property
What is the population within 1 mile of 728 Parkway Drive in Salyersville?
The population within 1 mile of 728 Parkway Drive Salyersville, KY 41465 is 640 people.
Who do I contact for questions about 728 Parkway Drive?
You should contact the listing agent,
Kyle Fant, for any details regarding this commercial listing.