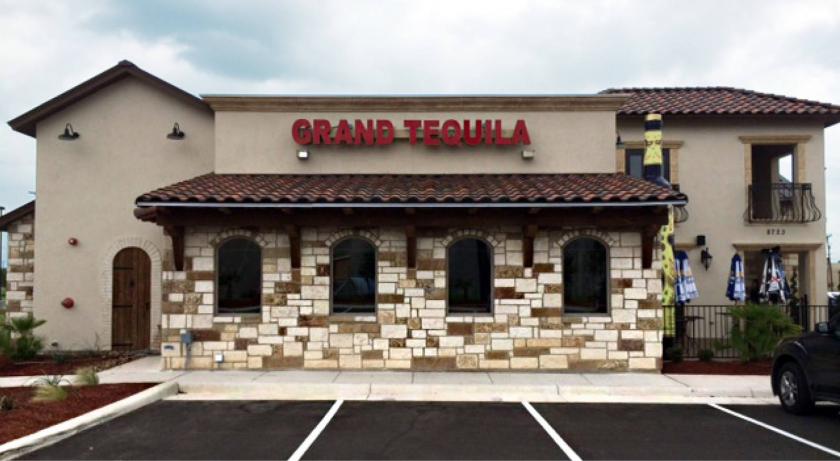
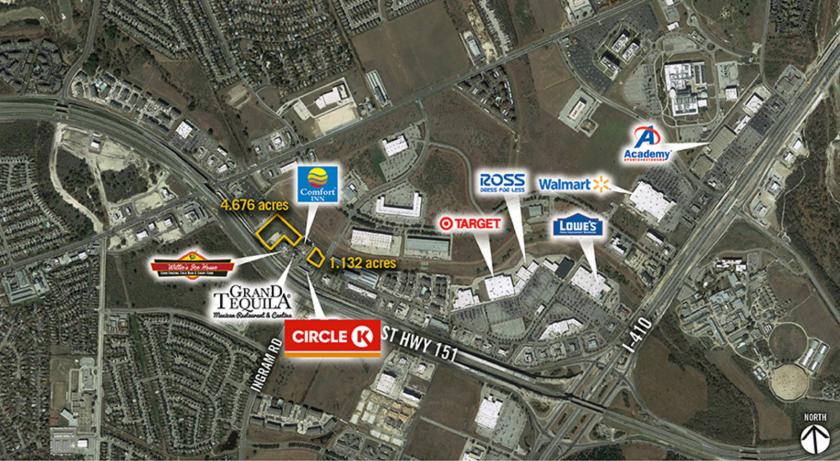
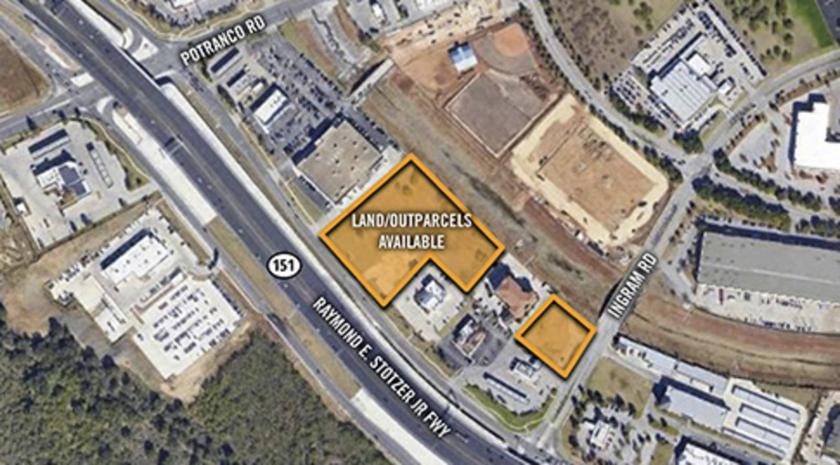
1-Mile | 3-Miles | 5-Miles | ||
---|---|---|---|---|
Total Population | 4,827 | 116,960 | 285,029 | |
Population Median Age | 34 | 34 | 33 | |
Population by Age | 0-9 Yrs | 458 (9%) | 16237 (13%) | 44032 (15%) |
10-19 Yrs | 604 (12%) | 17981 (15%) | 44264 (15%) | |
20-29 Yrs | 1158 (23%) | 17961 (15%) | 43210 (15%) | |
30-39 Yrs | 962 (19%) | 19381 (16%) | 47543 (16%) | |
40-49 Yrs | 656 (13%) | 15657 (13%) | 37276 (13%) | |
50-59 Yrs | 458 (9%) | 14334 (12%) | 31027 (10%) | |
60-69 Yrs | 290 (6%) | 9335 (7%) | 22403 (7%) | |
70+ Yrs | 242 (5%) | 6075 (5%) | 15274 (5%) | |
Median HH Income | $76,668 | $71,799 | $70,831 | |
Total Household Income | < 24K | 218 (11%) | 3834 (10%) | 10610 (12%) |
25-49K | 375 (19%) | 7279 (20%) | 17511 (20%) | |
50-74K | 348 (18%) | 8212 (22%) | 18371 (21%) | |
75-99K | 360 (18%) | 6156 (16%) | 14413 (16%) | |
100-199K | 549 (28%) | 9237 (25%) | 22714 (26%) | |
200K+ | 81 (4%) | 1674 (4%) | 3250 (3%) | |
Highest Education Level | No Diploma | 145 | 6439 | 17151 |
Diploma or GED | 503 | 17639 | 42831 | |
Some College | 834 | 18677 | 45028 | |
Assoc. Degree | 458 | 9079 | 19610 | |
Bachelors Degree | 746 | 14292 | 34126 | |
Higher Degree | 601 | 7796 | 17647 | |
Total Housing Units | 2,069 | 38,210 | 91,608 | |
--Owner-Occupied | 794 | 24,038 | 58,729 | |
--Renter-Occupied | 1,136 | 12,354 | 28,140 | |
Owner-Occupied Values | < 100K | 21 | 2472 | 7274 |
100-199K | 295 | 14679 | 33807 | |
200-299K | 289 | 5028 | 13517 | |
300-399K | 148 | 1452 | 3139 | |
400-499K | 23 | 316 | 723 | |
500K+ | 19 | 91 | 268 | |
Total Working Age Population | 3,970 | 89,697 | 213,267 | |
In Work Force | 2,965 | 63,616 | 150,820 | |
Not In Work Force | 1,004 | 26,080 | 62,447 | |
Workforce Employed | 2,816 | 58,686 | 139,065 | |
Workforce Unemployed | 66 | 3,381 | 8,267 | |
Civlian Workforce | 2,883 | 62,067 | 147,332 | |
Military Workforce | 83 | 1,549 | 3,488 | |
Total Households | 1,930 | 36,392 | 86,869 | |
Family Households | 1,142 | 26,734 | 64,304 | |
Non-Family Households | 788 | 9,658 | 22,565 | |
Married Couple | 850 | 19,507 | 46,351 | |
Other Family | 292 | 7,227 | 17,953 | |
Married w/Child | 331 | 9,565 | 23,451 | |
Single Male w/Child | 17 | 1,238 | 2,718 | |
Single Female w/Child | 177 | 2,864 | 7,430 |
Population Change Last Two Decades - Plus Projection
2000 | % | 2010 | % | 2020 | % | 2030 | |
---|---|---|---|---|---|---|---|
Texas | 20,851,820 | +21 | 25,145,561 | +18 | 29,677,668 | +18 | 34,894,452 |
Bexar County | 1,392,931 | +23 | 1,714,773 | +22 | 2,093,502 | +20 | 2,502,617 |
Total Working Age Population:
Total Households:
Total Working Age Population:
Total Households:
Total Working Age Population:
Total Households: