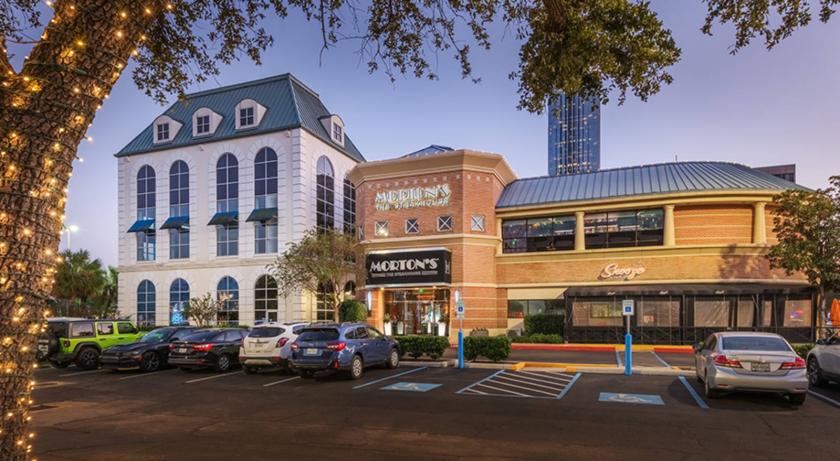
1-Mile | 3-Miles | 5-Miles | ||
---|---|---|---|---|
Total Population | 23,125 | 192,665 | 501,541 | |
Population Median Age | 40 | 37 | 37 | |
Population by Age | 0-9 Yrs | 2102 (9%) | 25797 (13%) | 64456 (12%) |
10-19 Yrs | 1253 (5%) | 18310 (9%) | 47813 (9%) | |
20-29 Yrs | 4817 (20%) | 32585 (16%) | 89989 (17%) | |
30-39 Yrs | 4677 (20%) | 36227 (18%) | 94727 (18%) | |
40-49 Yrs | 2744 (11%) | 24705 (12%) | 65554 (13%) | |
50-59 Yrs | 2705 (11%) | 21057 (10%) | 55591 (11%) | |
60-69 Yrs | 2128 (9%) | 17270 (8%) | 45490 (9%) | |
70+ Yrs | 2698 (11%) | 16714 (8%) | 37922 (7%) | |
Median HH Income | $106,793 | $75,987 | $75,433 | |
Total Household Income | < 24K | 1248 (10%) | 15228 (17%) | 39053 (17%) |
25-49K | 1494 (12%) | 15418 (17%) | 38966 (17%) | |
50-74K | 1346 (11%) | 12346 (14%) | 31465 (14%) | |
75-99K | 1651 (13%) | 9158 (10%) | 22476 (10%) | |
100-199K | 3744 (30%) | 17001 (19%) | 44542 (20%) | |
200K+ | 2751 (22%) | 17557 (20%) | 43247 (19%) | |
Highest Education Level | No Diploma | 522 | 14780 | 39319 |
Diploma or GED | 1041 | 15261 | 43892 | |
Some College | 2451 | 17436 | 44767 | |
Assoc. Degree | 879 | 6270 | 16530 | |
Bachelors Degree | 8016 | 45929 | 114129 | |
Higher Degree | 5670 | 37372 | 96745 | |
Total Housing Units | 15,269 | 99,529 | 250,305 | |
--Owner-Occupied | 4,173 | 31,094 | 88,335 | |
--Renter-Occupied | 8,061 | 55,615 | 131,413 | |
Owner-Occupied Values | < 100K | 149 | 1248 | 4845 |
100-199K | 474 | 3263 | 9671 | |
200-299K | 507 | 3076 | 9250 | |
300-399K | 288 | 2592 | 11444 | |
400-499K | 322 | 2079 | 9841 | |
500K+ | 2434 | 18835 | 43285 | |
Total Working Age Population | 20,245 | 154,871 | 406,821 | |
In Work Force | 15,057 | 111,168 | 293,161 | |
Not In Work Force | 5,188 | 43,704 | 113,660 | |
Workforce Employed | 14,598 | 107,613 | 282,074 | |
Workforce Unemployed | 459 | 3,459 | 10,945 | |
Civlian Workforce | 15,057 | 111,072 | 293,019 | |
Military Workforce | 0 | 96 | 143 | |
Total Households | 12,234 | 86,708 | 219,749 | |
Family Households | 5,279 | 44,700 | 114,555 | |
Non-Family Households | 6,955 | 42,008 | 105,194 | |
Married Couple | 4,611 | 34,668 | 87,431 | |
Other Family | 668 | 10,032 | 27,124 | |
Married w/Child | 1,614 | 15,310 | 37,854 | |
Single Male w/Child | 115 | 1,346 | 3,641 | |
Single Female w/Child | 143 | 3,800 | 10,477 |
Population Change Last Two Decades - Plus Projection
2000 | % | 2010 | % | 2020 | % | 2030 | |
---|---|---|---|---|---|---|---|
Texas | 20,851,820 | +21 | 25,145,561 | +18 | 29,677,668 | +18 | 34,894,452 |
Fort Bend County | 354,452 | +65 | 585,375 | +44 | 840,383 | +43 | 1,203,029 |
Harris County | 3,400,578 | +20 | 4,092,459 | +22 | 4,978,845 | +19 | 5,924,750 |
Total Working Age Population:
Total Households:
Total Working Age Population:
Total Households:
Total Working Age Population:
Total Households: