Industrial Properties
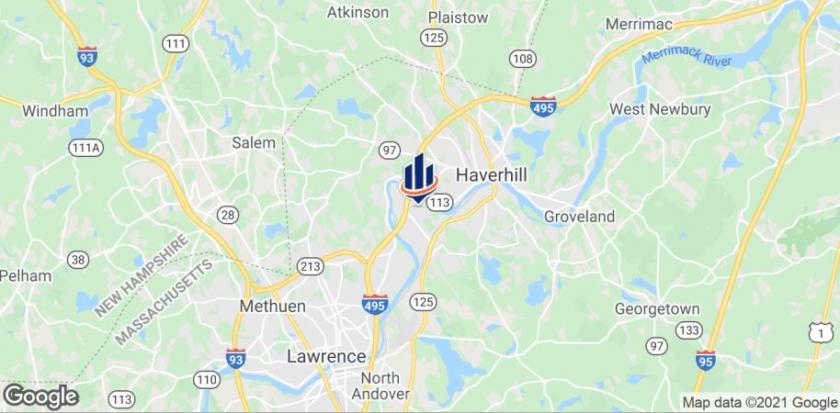
22 Parkridge Road Haverhill, MA 01835
22 Parkridge Road Haverhill, MA 01835

Details & Description
Property Highlights
- • 70 Warehouse and 30 Office
- • ESD Epoxy Floor
- • 22 Foot Clear Height
- • Drive-In and Tailboard
- • Manufacturing area Fully Painted
- • ESD carpeting First Floor Offices
Listing Agents

Arlon Brown
O: 508-271-9215
M: 617-962-0162
arlon.brown@svn.com
O: 508-271-9215
M: 617-962-0162
arlon.brown@svn.com
While we strive to provide the most accurate information, all listing information, and demographic data, is provided by third-parties. As such, MyEListing will not be responsible for the accuracy of the information. It is strongly recommended that you verify all information with the listing agent, and any relevant agencies, prior to making any decisions.