Office Space
126 Union Street Marlborough, MA 01752
126 Union Street Marlborough, MA 01752

Details & Description
Property Highlights
• Located diagonally across from Marlborough Hospital
• Established Medical Office Building
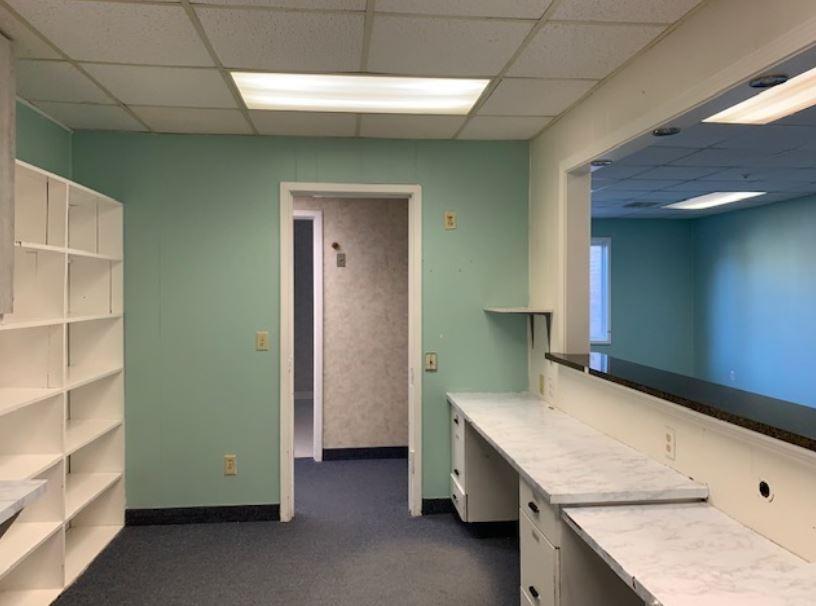
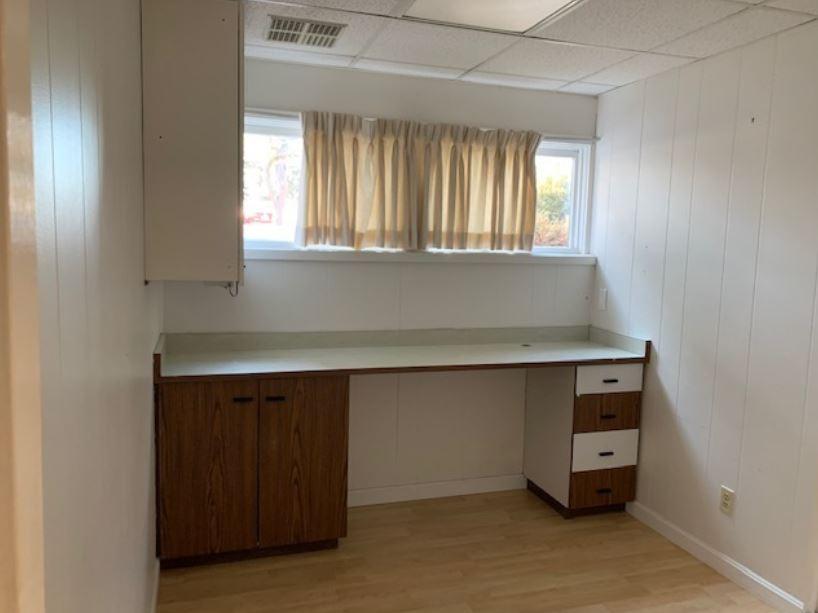
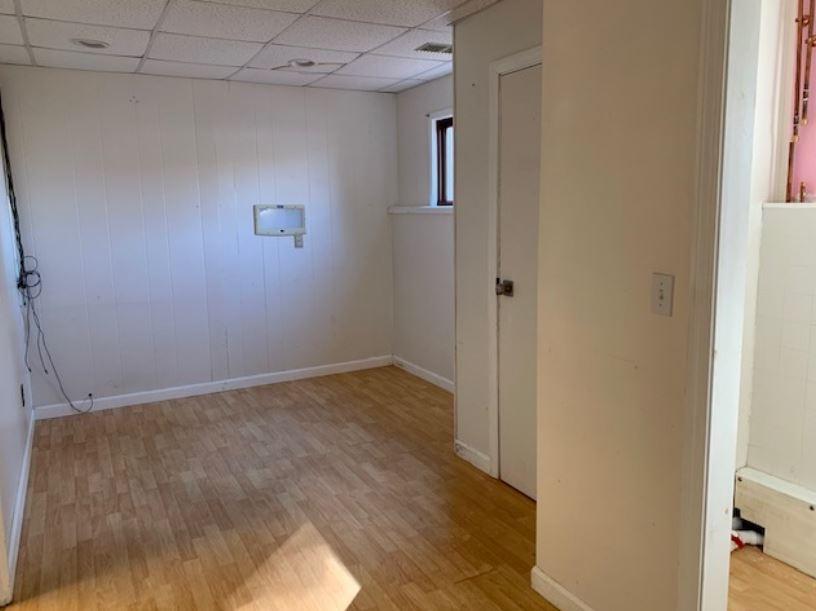
Additional Photos

Listing Agents

Marci Alvarado
O: 508-271-9219
M: 508-561-8770
marci@commercialpropertyadvisors.net
O: 508-271-9219
M: 508-561-8770
marci@commercialpropertyadvisors.net
While we strive to provide the most accurate information, all listing information, and demographic data, is provided by third-parties. As such, MyEListing will not be responsible for the accuracy of the information. It is strongly recommended that you verify all information with the listing agent, and any relevant agencies, prior to making any decisions.


