Office Space
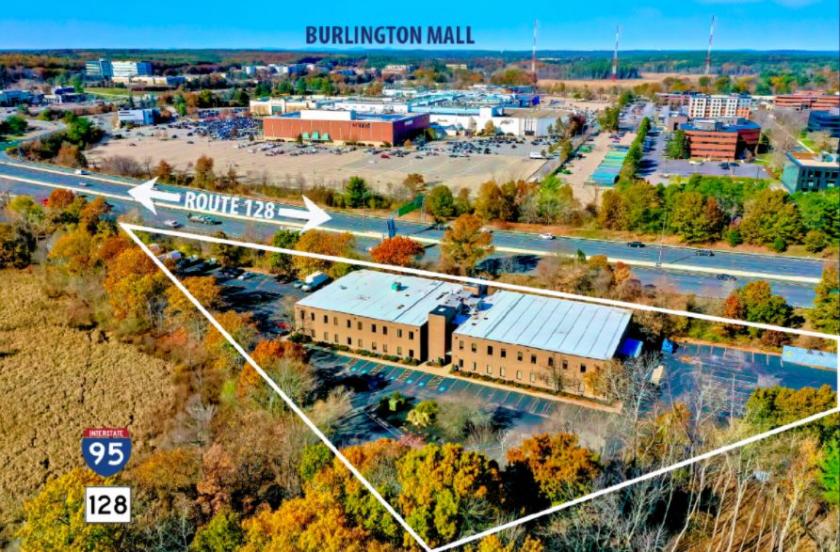
1 Rounder Way Burlington, MA 01803
1 Rounder Way Burlington, MA 01803
Details & Description
Property Highlights
- • Prominent and Irreplaceable Location
- • New Roof Installed in 2013
- • 3.5 Acres with Over 250 Parking Spaces
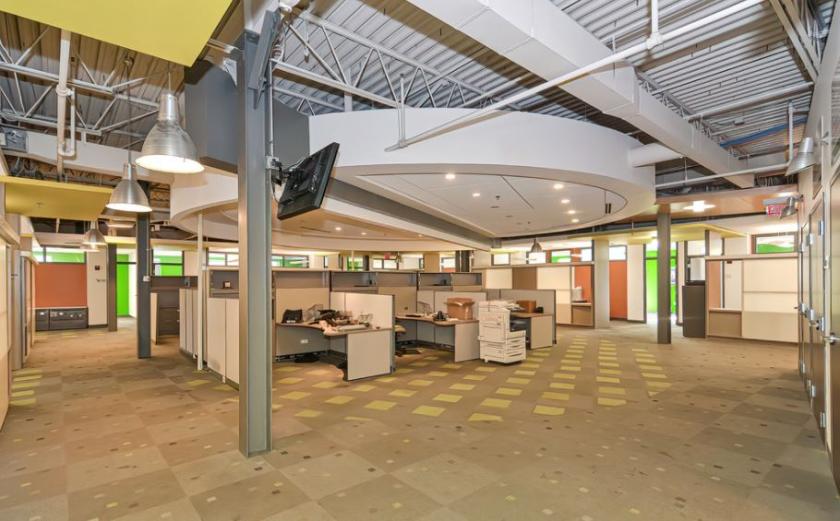
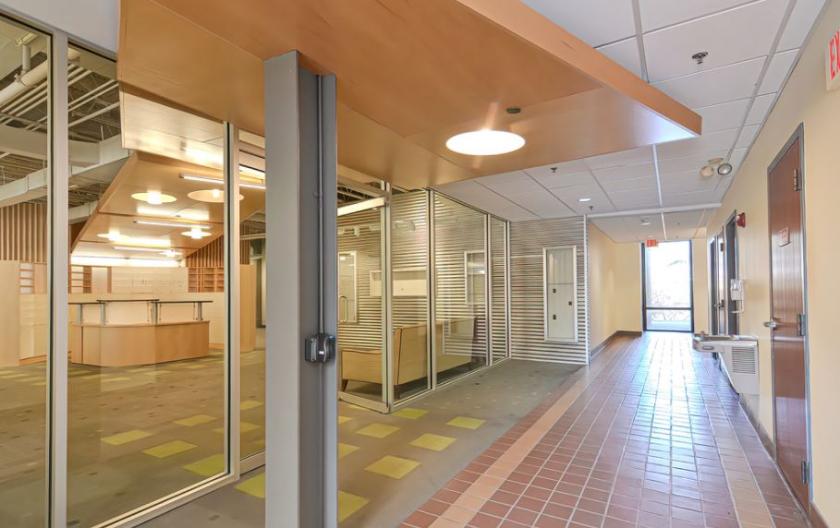
- • Class A Office Finishes
- • 1100 Feet of Frontage on Route 128
Additional Photos


Listing Agents

Marci Alvarado
O: 508-271-9219
M: 508-561-8770
marci@commercialpropertyadvisors.net
O: 508-271-9219
M: 508-561-8770
marci@commercialpropertyadvisors.net
While we strive to provide the most accurate information, all listing information, and demographic data, is provided by third-parties. As such, MyEListing will not be responsible for the accuracy of the information. It is strongly recommended that you verify all information with the listing agent, and any relevant agencies, prior to making any decisions.


