Specialty Real Estate
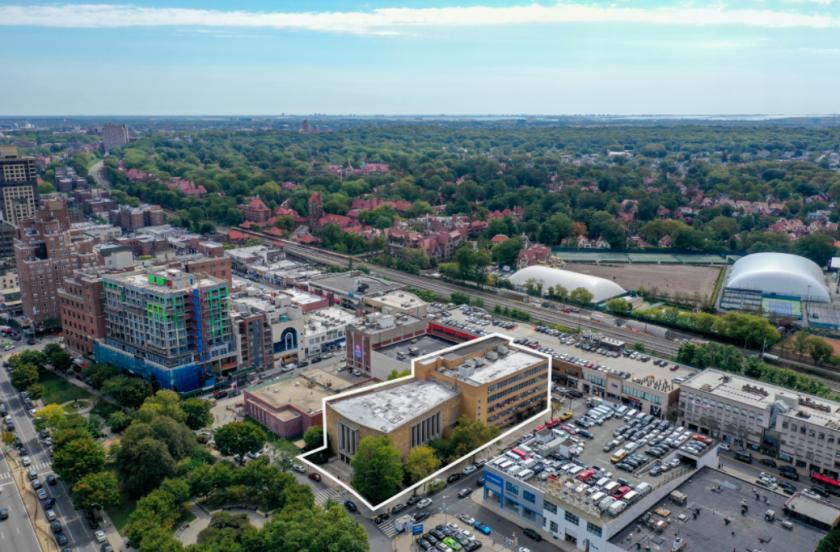
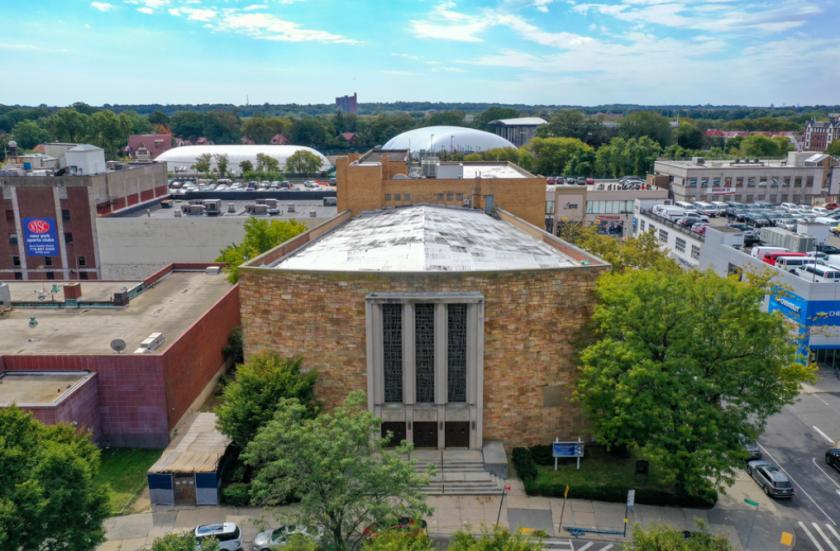
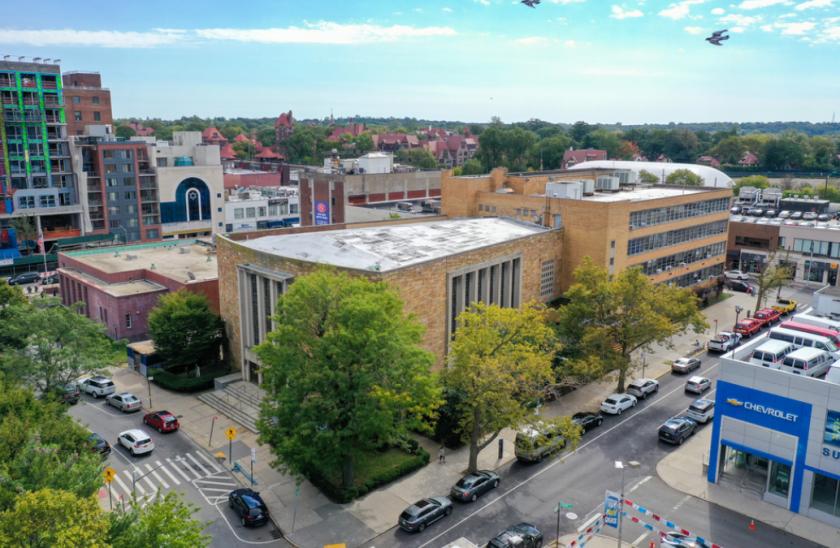
106 Queens Boulevard Queens, NY 11375
106 Queens Boulevard Queens, NY 11375
Details & Description
Property Highlights
- • - 180,690 BUILDABLE SF
- • 534 OF COMBINED FRONTAGE
- • C4-5X, FH R7X ZONING DISTRICT
- • LOCATED WITHIN A QUALIFIED OPPORTUNITY ZONE
- • NEAR MTA SUBWAY LIRR STATIONS
Listing Agents

Thomas A. Donovan
O: 646-933-2635
tdonovan@b6realestate.com
O: 646-933-2635
tdonovan@b6realestate.com
While we strive to provide the most accurate information, all listing information, and demographic data, is provided by third-parties. As such, MyEListing will not be responsible for the accuracy of the information. It is strongly recommended that you verify all information with the listing agent, and any relevant agencies, prior to making any decisions.