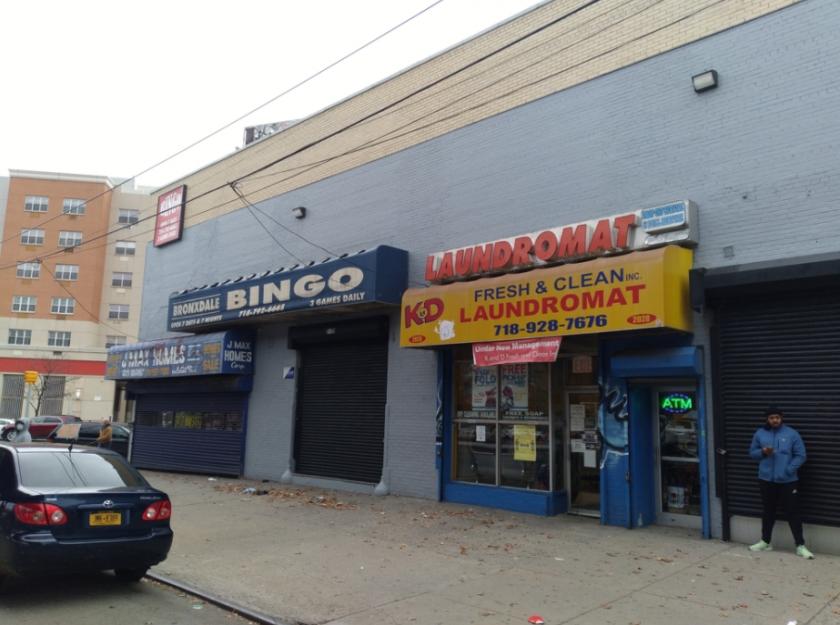
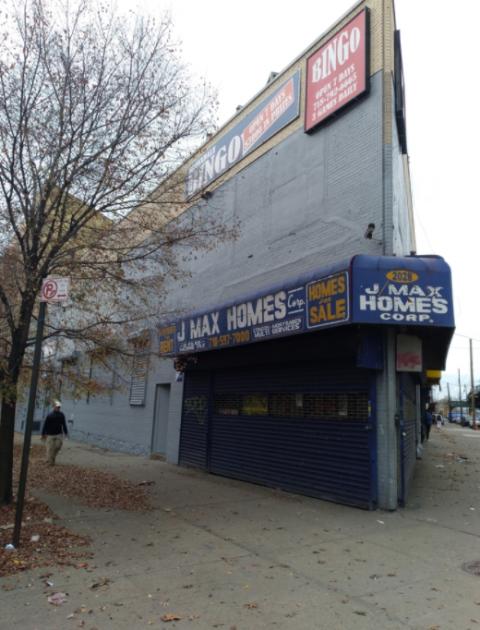
Retail Space
2028 White Plains Road Bronx, NY 10462
2028 White Plains Road Bronx, NY 10462
Details & Description
Property Highlights
- • Traffic Light Corner
- • Combined average daily traffic of approx. 24,000
- • Close to the Bronx River Pkwy Cross Bronx Expy
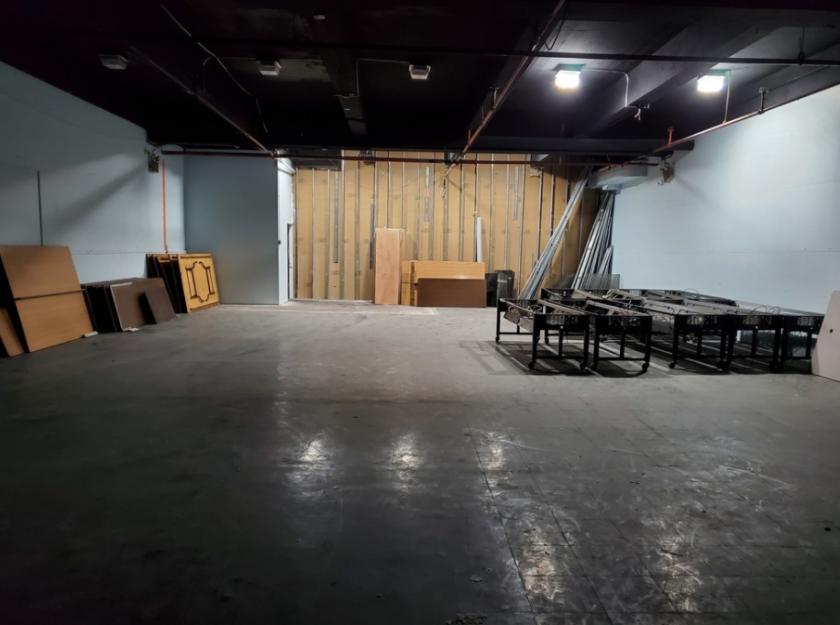
Additional Photos


Listing Agents

Thomas A. Donovan
O: 646-933-2635
tdonovan@b6realestate.com
O: 646-933-2635
tdonovan@b6realestate.com
While we strive to provide the most accurate information, all listing information, and demographic data, is provided by third-parties. As such, MyEListing will not be responsible for the accuracy of the information. It is strongly recommended that you verify all information with the listing agent, and any relevant agencies, prior to making any decisions.


