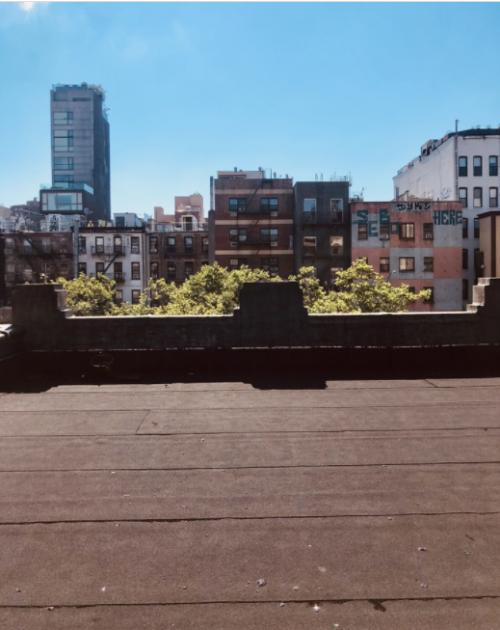
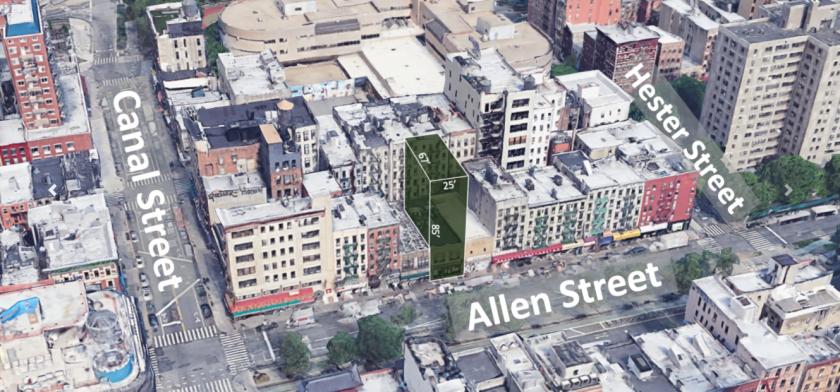
B6 Real Estate Advisors, as the exclusive broker, is proud to present 25 Allen Street, located in Manhattan's Lower East Side/ Chinatown neighborhood. The vacant 2-story retail / loft building was built in 1900. It was formerly home to the Joe-Ber brand of women's sportswear and served as its manufacturing and distribution facility.
Located in close proximity to the B, D, F, M, J and Z subway stations and a short walk to the new 1.9 million SF Essex Crossing development. 25 Allen Street is ideal for a boutique office development or owner-user looking to be in a hip neighborhood with excellent transportation.
Highlights
- Boutique office development opportunity - 13,429 buildable SF.
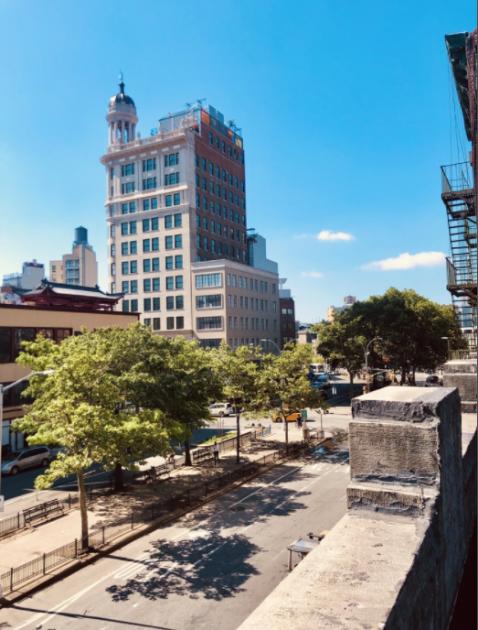
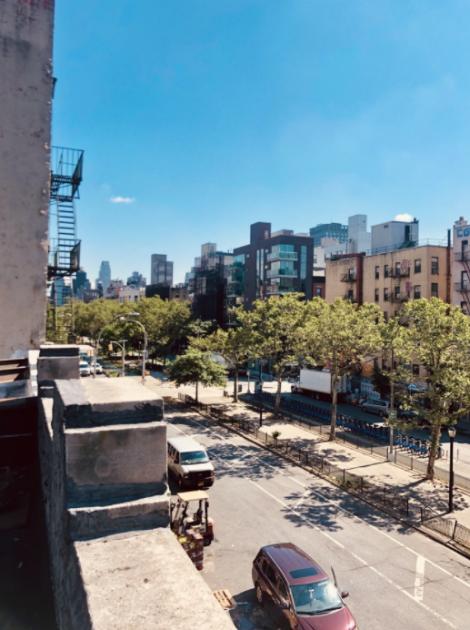
- Convenient Lower East Side / Chinatown location with rare park-like environment on Allen Street.
- A short walk to the 1.9 million SF Essex Crossing development which features excellent entertainment and dining options.
- Nestled at the center of many new projects including boutique office rentals and luxury residences.
- 2-story vacant commercial loft with exposed brick and wood floors.
No part of this information may be copied, reproduced, repurposed, or screen-captured for any commercial purpose without prior written authorization from MyEListing.
While we strive to provide the most accurate information, all listing information, and demographic data, is provided by third-parties. As such, MyEListing will not be responsible for the accuracy of the information. It is strongly recommended that you verify all information with the listing agent, and any relevant agencies, prior to making any decisions.
What is the asking price for 25 Allen Street in New York?
The asking price for 25 Allen Street is $4,500,000
What is the building size of this Retail property in New York, NY?
The size of the building/unit at 25 Allen Street in New York is 3,892 square feet
How much land does the New York, NY property at 25 Allen Street include?
25 Allen Street in New York includes 0.050 acres of land
What kind of Retail is the propery at 25 Allen Street?
The property at 25 Allen Street New York, NY 10002 is listed as a Free Standing Building Retail property
What is the population within 1 mile of 25 Allen Street in New York?
The population within 1 mile of 25 Allen Street New York, NY 10002 is 191,794 people.
Who do I contact for questions about 25 Allen Street?
You should contact the listing agent,
Stephen Dadourian, for any details regarding this commercial listing.