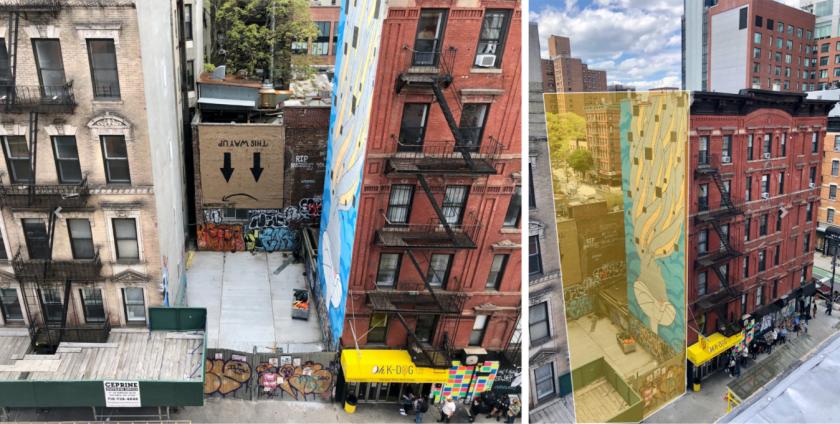
1-Mile | 3-Miles | 5-Miles | ||
---|---|---|---|---|
Total Population | 225,933 | 1,147,148 | 2,767,285 | |
Population Median Age | 41 | 37 | 38 | |
Population by Age | 0-9 Yrs | 12717 (5%) | 113513 (9%) | 295452 (10%) |
10-19 Yrs | 19378 (8%) | 85366 (7%) | 224852 (8%) | |
20-29 Yrs | 49051 (21%) | 233675 (20%) | 511635 (18%) | |
30-39 Yrs | 39244 (17%) | 262442 (22%) | 578853 (20%) | |
40-49 Yrs | 26221 (11%) | 144997 (12%) | 361016 (13%) | |
50-59 Yrs | 25120 (11%) | 112705 (9%) | 299148 (10%) | |
60-69 Yrs | 25691 (11%) | 98837 (8%) | 248735 (8%) | |
70+ Yrs | 28511 (12%) | 95614 (8%) | 247594 (8%) | |
Median HH Income | $66,628 | $108,088 | $90,962 | |
Total Household Income | < 24K | 29468 (27%) | 95419 (17%) | 225870 (18%) |
25-49K | 15918 (14%) | 60640 (11%) | 165388 (13%) | |
50-74K | 12276 (11%) | 51909 (9%) | 143878 (11%) | |
75-99K | 9823 (9%) | 48429 (8%) | 124569 (10%) | |
100-199K | 21647 (20%) | 140824 (25%) | 306393 (24%) | |
200K+ | 18393 (17%) | 144553 (26%) | 263257 (21%) | |
Highest Education Level | No Diploma | 34121 | 87002 | 236900 |
Diploma or GED | 23798 | 94617 | 325944 | |
Some College | 15051 | 71526 | 206018 | |
Assoc. Degree | 6316 | 26579 | 85817 | |
Bachelors Degree | 57129 | 325451 | 666241 | |
Higher Degree | 37670 | 265461 | 550739 | |
Total Housing Units | 119,549 | 619,395 | 1,401,501 | |
--Owner-Occupied | 17,610 | 134,248 | 323,881 | |
--Renter-Occupied | 89,914 | 407,527 | 905,474 | |
Owner-Occupied Values | < 100K | 979 | 4595 | 9569 |
100-199K | 273 | 3055 | 8912 | |
200-299K | 385 | 3168 | 14636 | |
300-399K | 653 | 5146 | 19680 | |
400-499K | 974 | 7547 | 21512 | |
500K+ | 14346 | 110737 | 249572 | |
Total Working Age Population | 205,540 | 987,377 | 2,338,405 | |
In Work Force | 125,125 | 708,431 | 1,642,808 | |
Not In Work Force | 80,415 | 278,946 | 695,597 | |
Workforce Employed | 118,946 | 677,071 | 1,565,042 | |
Workforce Unemployed | 6,157 | 31,156 | 77,196 | |
Civlian Workforce | 125,103 | 708,227 | 1,642,238 | |
Military Workforce | 22 | 204 | 570 | |
Total Households | 107,524 | 541,775 | 1,229,355 | |
Family Households | 42,043 | 226,630 | 585,848 | |
Non-Family Households | 65,481 | 315,145 | 643,506 | |
Married Couple | 27,795 | 170,810 | 407,683 | |
Other Family | 14,248 | 55,820 | 178,165 | |
Married w/Child | 7,566 | 66,211 | 165,562 | |
Single Male w/Child | 763 | 4,222 | 14,985 | |
Single Female w/Child | 4,029 | 17,349 | 56,113 |
Population Change Last Two Decades - Plus Projection
2000 | % | 2010 | % | 2020 | % | 2030 | |
---|---|---|---|---|---|---|---|
New Jersey | 8,414,350 | +4 | 8,791,894 | +4 | 9,132,700 | +4 | 9,530,900 |
Bergen County | 884,118 | +2 | 905,116 | +7 | 967,500 | +7 | 1,031,500 |
Hudson County | 608,975 | +4 | 634,266 | +12 | 708,100 | +6 | 747,400 |
New York | 18,976,457 | +2 | 19,378,102 | +4 | 20,146,131 | +2 | 20,604,030 |
Kings County | 2,465,326 | +2 | 2,504,700 | +9 | 2,738,283 | +5 | 2,863,996 |
New York County | 1,537,195 | +3 | 1,585,873 | +6 | 1,688,894 | +2 | 1,727,631 |
Queens County | 2,229,379 | 0 | 2,230,722 | +9 | 2,436,549 | +5 | 2,565,268 |
Total Working Age Population:
Total Households:
Total Working Age Population:
Total Households:
Total Working Age Population:
Total Households: