Industrial Properties
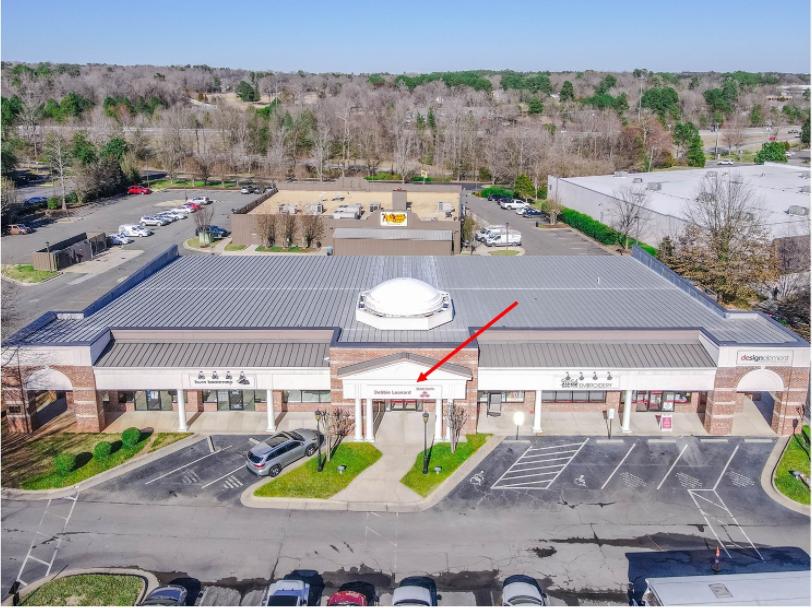
3702 Hillsborough Road Durham, NC 27705
3702 Hillsborough Road Durham, NC 27705
Details & Description
Property Highlights
- • 1,975 Square Feet
- • 8 Offices
- • Break Room
- • 14 mile from I-85, Cole mill Road exit
- • Available between June 1 and July 1, 2021
Listing Agents

Vernon Averett
Pickett Sprouse CRE
O: 919-287-3053
vaverett@aol.com
Pickett Sprouse CRE
O: 919-287-3053
vaverett@aol.com
While we strive to provide the most accurate information, all listing information, and demographic data, is provided by third-parties. As such, MyEListing will not be responsible for the accuracy of the information. It is strongly recommended that you verify all information with the listing agent, and any relevant agencies, prior to making any decisions.


