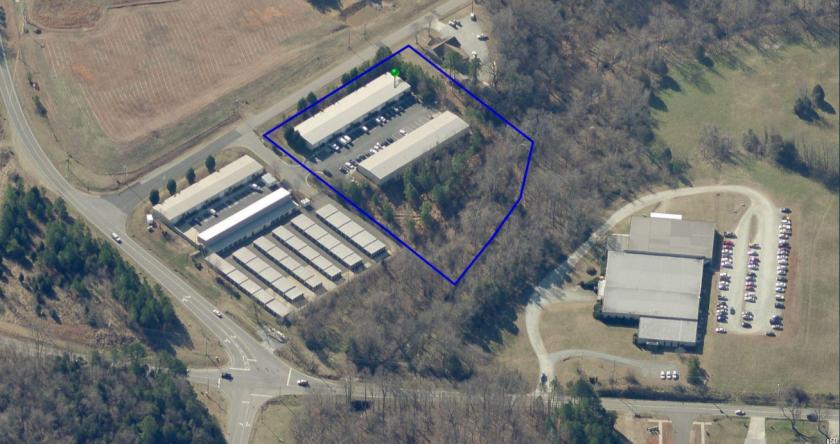
Industrial Properties
620 Valley Forge Road Hillsborough, NC 27278
620 Valley Forge Road Hillsborough, NC 27278

Details & Description
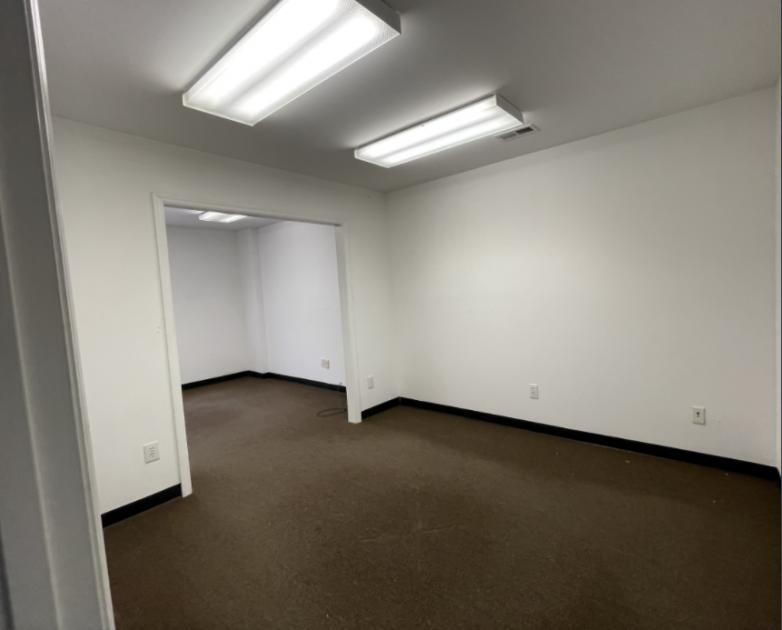
Property Highlights
- • Fully heated and air conditioned
- • Reception area
- • Four offices
- • Shared loading dock
Listing Agents

Emilee Collins
O: 919-730-7040
emilee@westandwoodall.com
O: 919-730-7040
emilee@westandwoodall.com
While we strive to provide the most accurate information, all listing information, and demographic data, is provided by third-parties. As such, MyEListing will not be responsible for the accuracy of the information. It is strongly recommended that you verify all information with the listing agent, and any relevant agencies, prior to making any decisions.