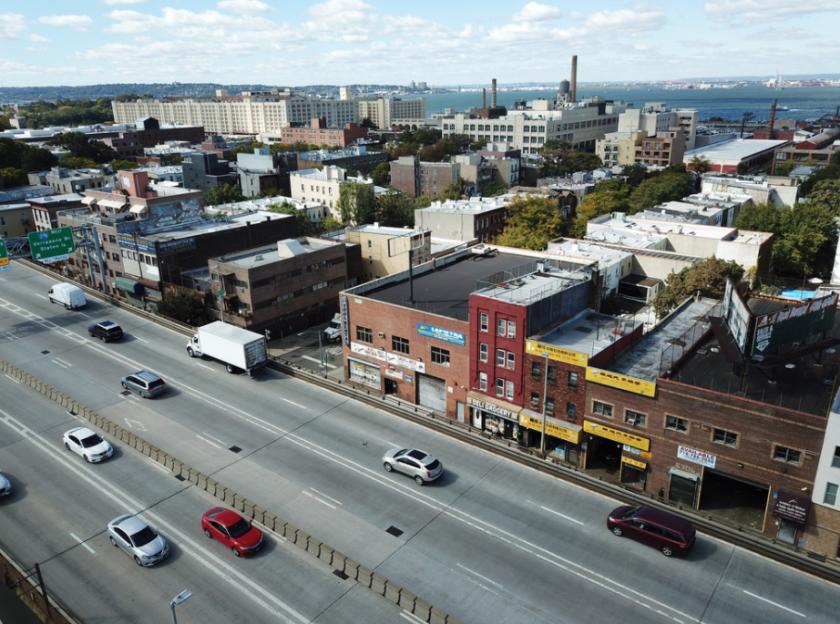
Industrial Properties
5320 3rd Avenue Brooklyn, NY 11220
5320 3rd Avenue Brooklyn, NY 11220
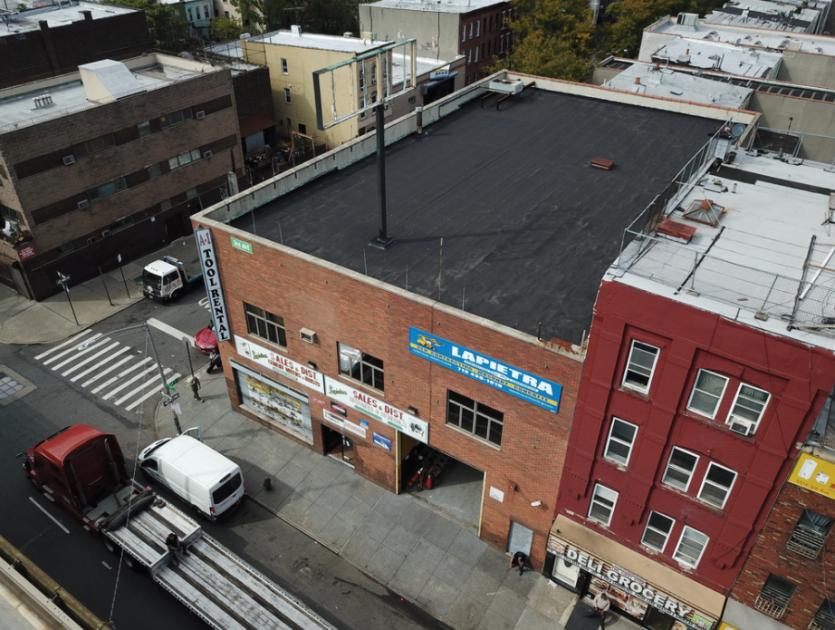
Details & Description
Property Highlights
• Blank canvas, with significant owner user opportunity or potential to utilize community facility FAR bonus
• Large development opportunity with additional flexibility with parking lot in rear
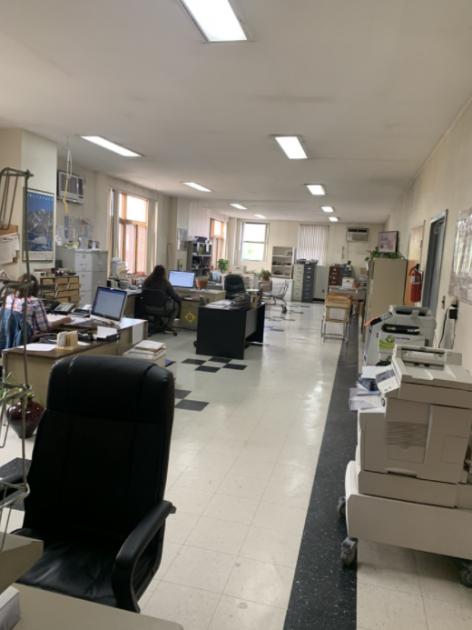
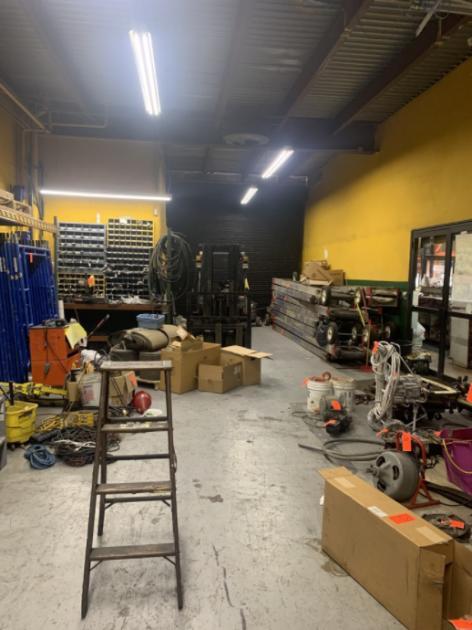
Additional Photos

Listing Agents

Greg Melanson
O: 718-475-4324
gregory.melanson@marcusmillichap.com
O: 718-475-4324
gregory.melanson@marcusmillichap.com
While we strive to provide the most accurate information, all listing information, and demographic data, is provided by third-parties. As such, MyEListing will not be responsible for the accuracy of the information. It is strongly recommended that you verify all information with the listing agent, and any relevant agencies, prior to making any decisions.


