Industrial Properties
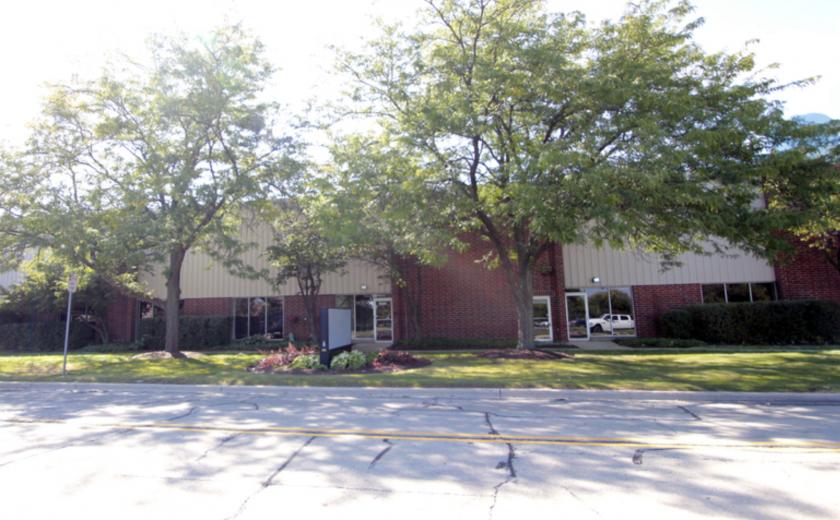
4500 Western Avenue Lisle, IL 60532
4500 Western Avenue Lisle, IL 60532
Details & Description
Property Highlights
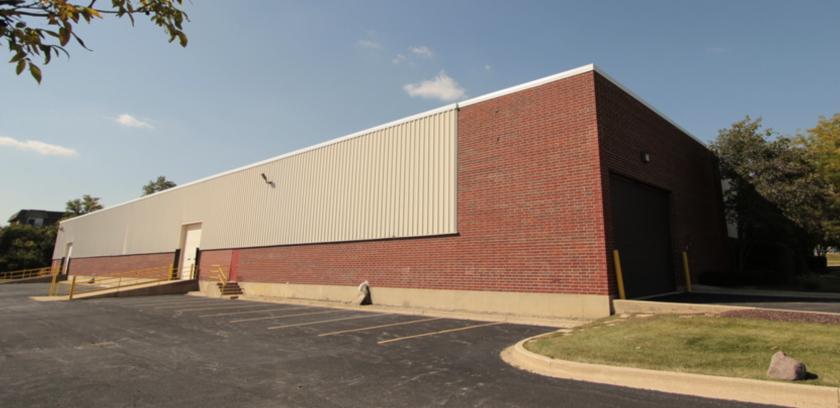
- • 100 car parking spaces expandable
- • 4 drive-in doors Two 13 x 14 Two 15 x 14
- • 40 x 40 column spacing
- • - 8,000 SF office
- • 5 interior docks
- • Heavy power - 1,200 amps
Listing Agents

Mark Moran
O: 630-693-0656
mmoran@hiffman.com
O: 630-693-0656
mmoran@hiffman.com
While we strive to provide the most accurate information, all listing information, and demographic data, is provided by third-parties. As such, MyEListing will not be responsible for the accuracy of the information. It is strongly recommended that you verify all information with the listing agent, and any relevant agencies, prior to making any decisions.