Office Space
I-55 and I-80 Joliet, IL 60431
I-55 and I-80 Joliet, IL 60431

Details & Description
Property Highlights
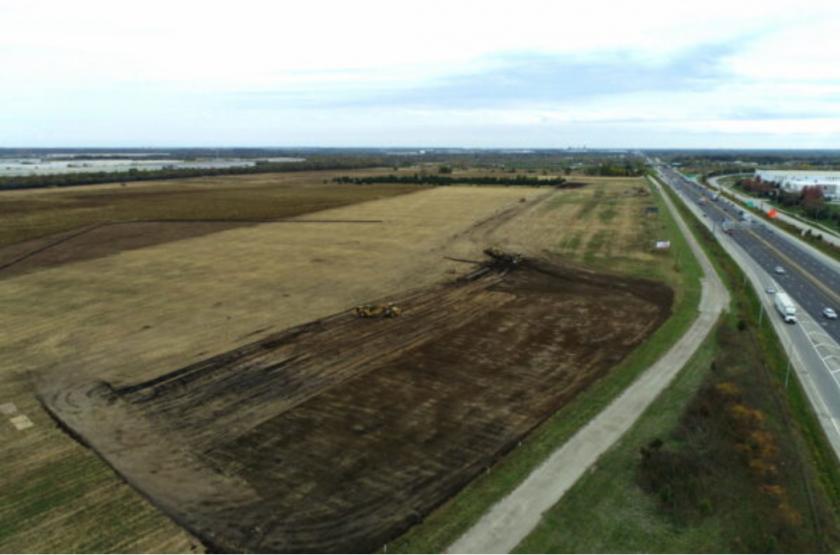
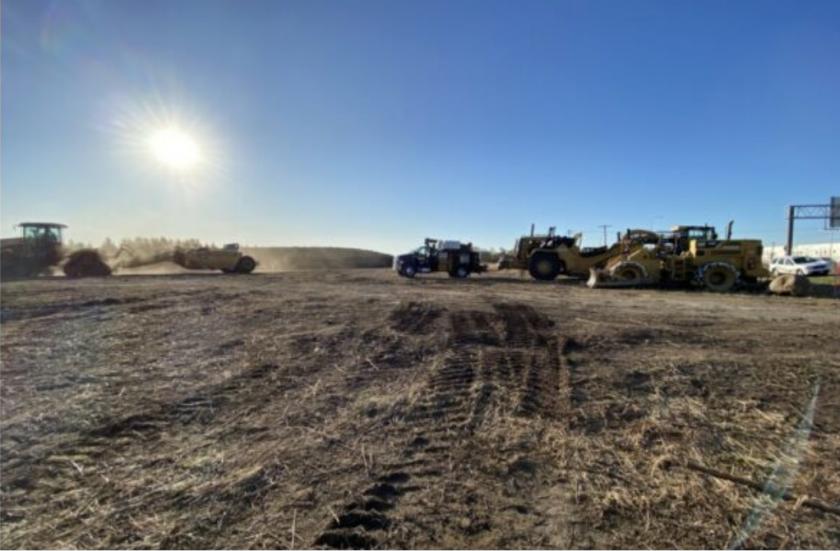
• Office users leasing at Rock Run Crossings will enjoy outdoor dining, shopping convenience, entertainment and leisure
• Plentiful parking and high visibility will benefit office users.
Listing Agents

Adam Johnson
O: 630-317-0729
ajohnson@hiffman.com
O: 630-317-0729
ajohnson@hiffman.com

Jim Adler
O: 630-691-0605
M: 630-745-7042
jadler@hiffman.com
O: 630-691-0605
M: 630-745-7042
jadler@hiffman.com

Tom Gnadt
O: 630-693-0659
tgnadt@hiffman.com
O: 630-693-0659
tgnadt@hiffman.com
While we strive to provide the most accurate information, all listing information, and demographic data, is provided by third-parties. As such, MyEListing will not be responsible for the accuracy of the information. It is strongly recommended that you verify all information with the listing agent, and any relevant agencies, prior to making any decisions.