Office Space
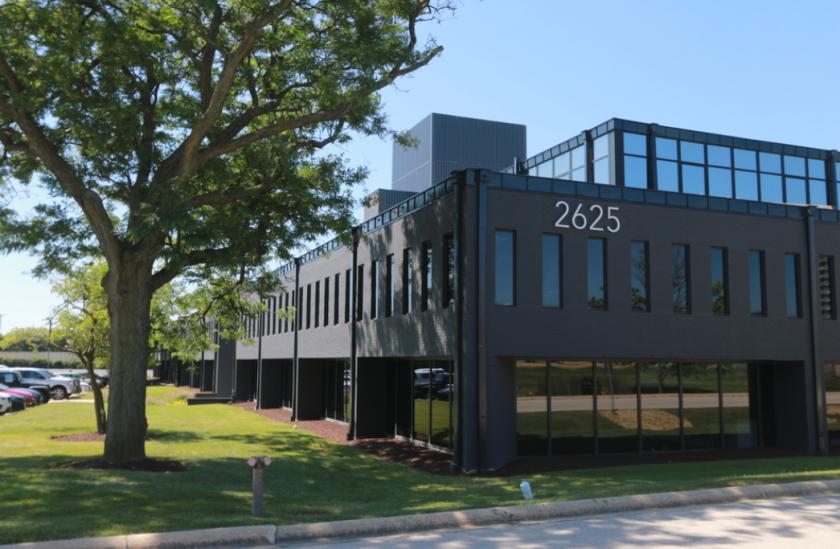
2625 Butterfield Road Oak Brook, IL 60523
2625 Butterfield Road Oak Brook, IL 60523
Details & Description
Property Highlights
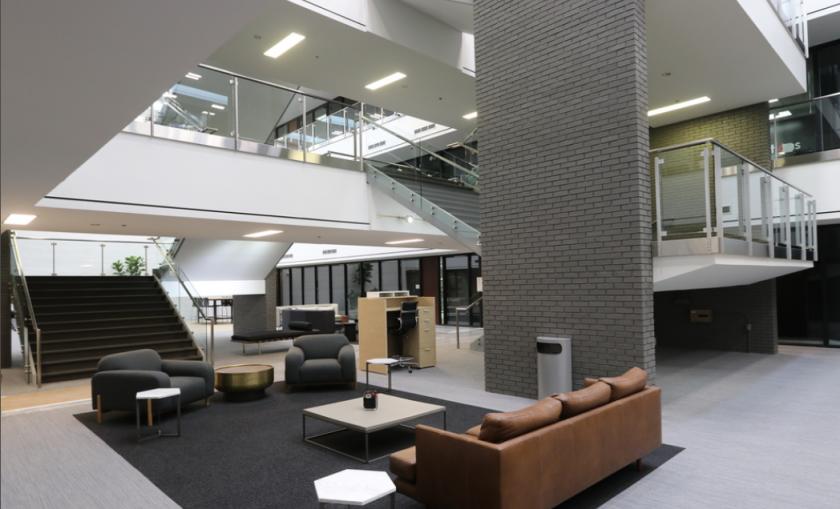
- • New building conference room training facility
- • New spec suites
- • On-site property management
- • Storage space is available
Listing Agents

Adam Johnson
O: 630-317-0729
ajohnson@hiffman.com
O: 630-317-0729
ajohnson@hiffman.com

Ryan Maher
O: 630-303-1473
rmaher@hiffman.com
O: 630-303-1473
rmaher@hiffman.com
While we strive to provide the most accurate information, all listing information, and demographic data, is provided by third-parties. As such, MyEListing will not be responsible for the accuracy of the information. It is strongly recommended that you verify all information with the listing agent, and any relevant agencies, prior to making any decisions.