Industrial Properties
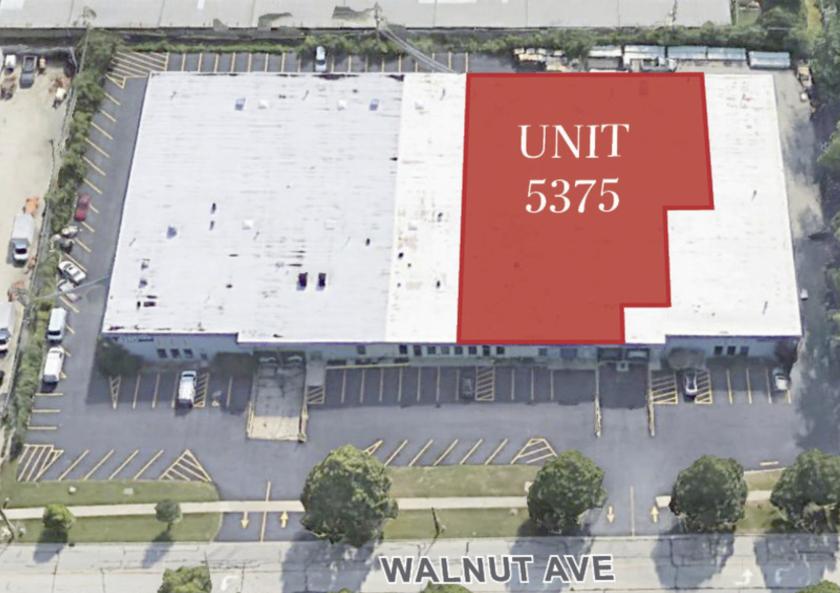
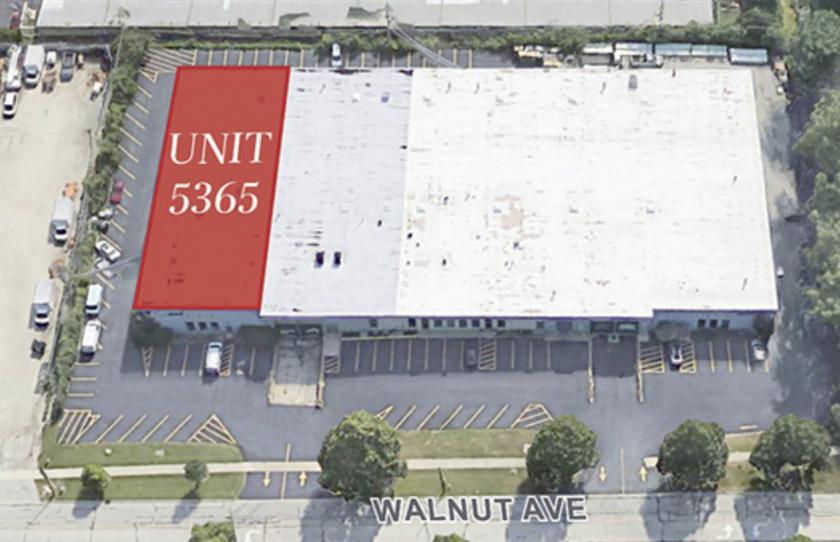
5365 Walnut Avenue Downers Grove, IL 60515
5365 Walnut Avenue Downers Grove, IL 60515
Details & Description
Property Highlights
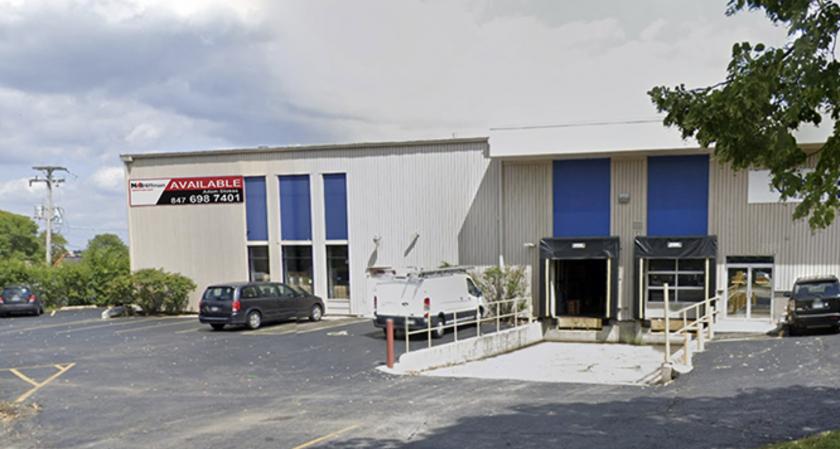
- • CLEAR HEIGHT 22
- • OFFICE AREA 3,000 SF
- • LOADING 1 EXTERIOR DOCK 2 DRIVE-IN DOORS
- • SPRINKLERED FULLY
- • POWER 200A 240V 3-PHASE
Listing Agents

Adam Stokes
O: 312-498-7400
M: 312-498-7400
astokes@hiffman.com
O: 312-498-7400
M: 312-498-7400
astokes@hiffman.com
While we strive to provide the most accurate information, all listing information, and demographic data, is provided by third-parties. As such, MyEListing will not be responsible for the accuracy of the information. It is strongly recommended that you verify all information with the listing agent, and any relevant agencies, prior to making any decisions.