Industrial Properties
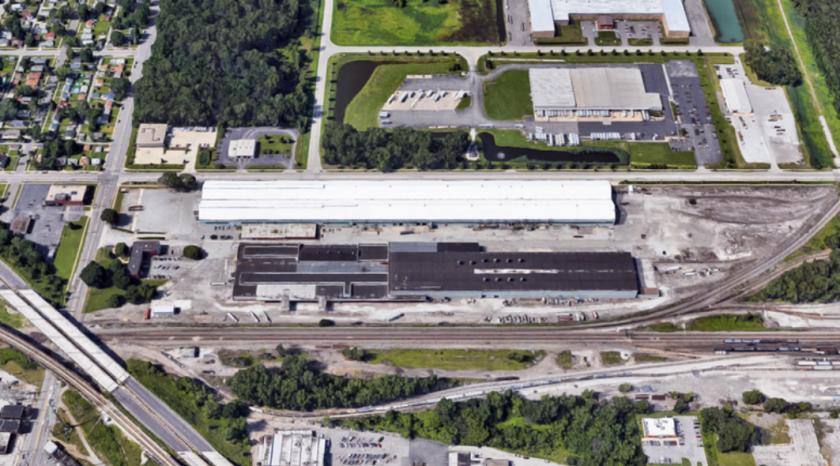
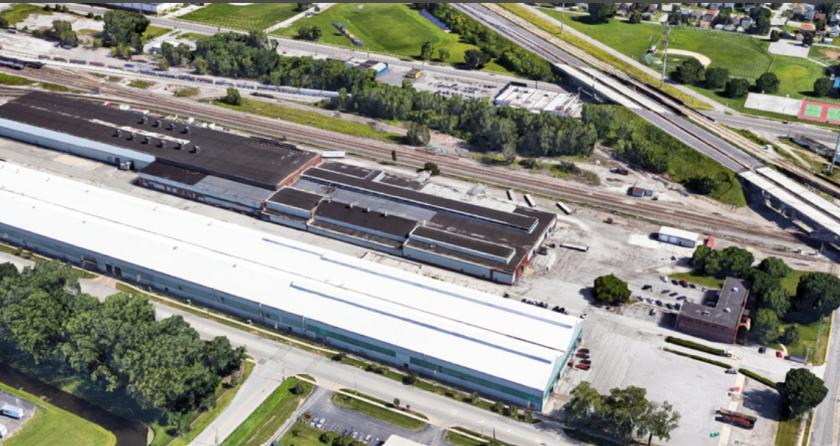
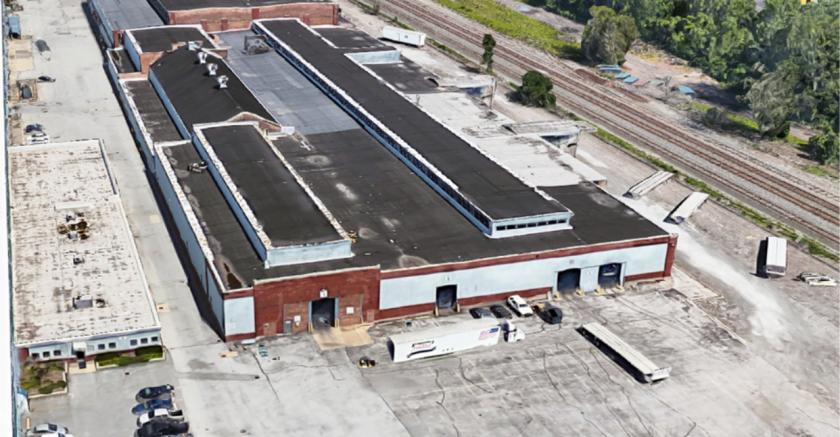
4531 Columbia Avenue Hammond, IN 46327
4531 Columbia Avenue Hammond, IN 46327
Details & Description
Property Highlights
- • 20 clear ceiling height
- • 1 5-ton overhead crane
- • Office space available in free standing building
- • CSX Rail available
- • Lease rate $1.95 PSF net
- • Unit A - 84,904 SF Land 15.173 acres
Listing Agents

Chris Gary
NAI Hiffman
O: 630-693-0694
M: 708-712-9200
cgary@hiffman.com
NAI Hiffman
O: 630-693-0694
M: 708-712-9200
cgary@hiffman.com

Alex Sutterer
O: 630-693-0644
M: 330-217-5926
asutterer@hiffman.com
O: 630-693-0644
M: 330-217-5926
asutterer@hiffman.com
While we strive to provide the most accurate information, all listing information, and demographic data, is provided by third-parties. As such, MyEListing will not be responsible for the accuracy of the information. It is strongly recommended that you verify all information with the listing agent, and any relevant agencies, prior to making any decisions.