Commercial Land
2299 W Haven Ave Joliet, IL 60433
2299 W Haven Ave Joliet, IL 60433
Details & Description
Property Highlights
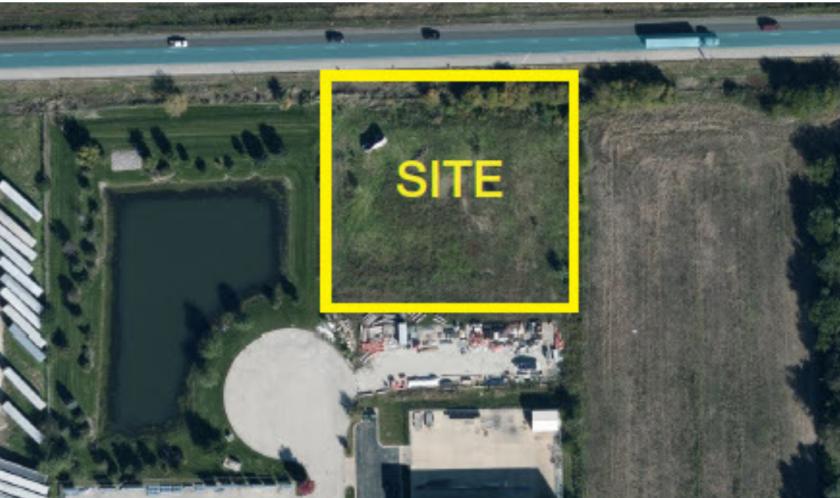
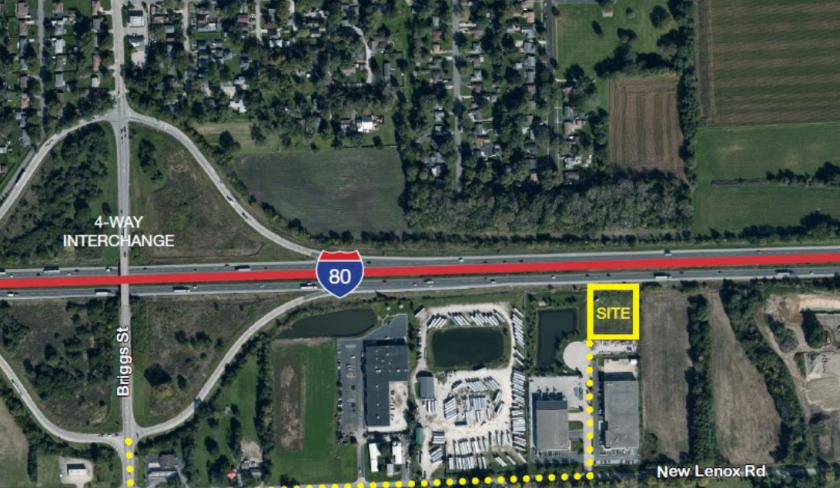
- • Off-site detention
- • Located in Unincorporated Will County
- • Outside storage allowed
- • Fully improved and pad ready
Listing Agents

Chris Gary
NAI Hiffman
O: 630-693-0694
M: 708-712-9200
cgary@hiffman.com
NAI Hiffman
O: 630-693-0694
M: 708-712-9200
cgary@hiffman.com

Alex Sutterer
O: 630-693-0644
M: 330-217-5926
asutterer@hiffman.com
O: 630-693-0644
M: 330-217-5926
asutterer@hiffman.com
While we strive to provide the most accurate information, all listing information, and demographic data, is provided by third-parties. As such, MyEListing will not be responsible for the accuracy of the information. It is strongly recommended that you verify all information with the listing agent, and any relevant agencies, prior to making any decisions.