Office Space
1744 Oak Avenue Evanston, IL 60201
1744 Oak Avenue Evanston, IL 60201

Details & Description
Property Highlights
• Open floor plan with up to 9 private or shared workspaces - most on windowline andor with glass walls and sliding doors
• Stunning 2-story, light filled corporateentreprenuerial office with urban loftgallery character
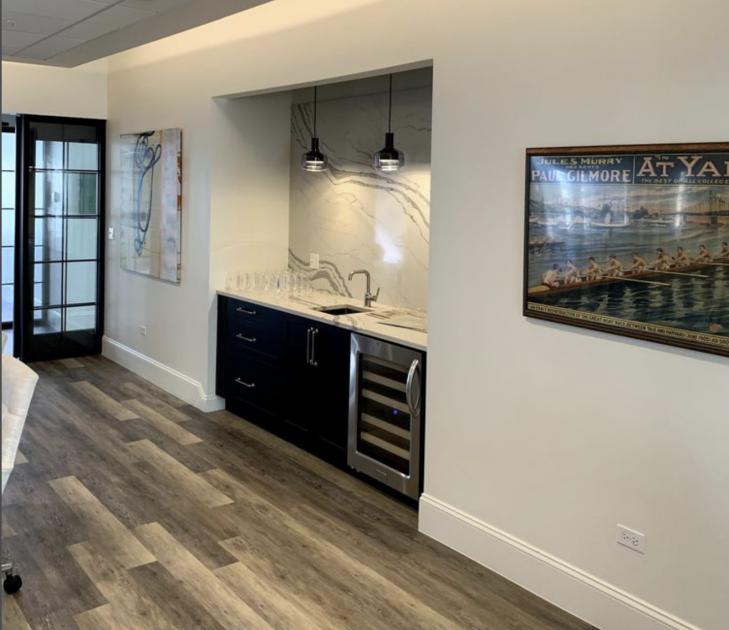
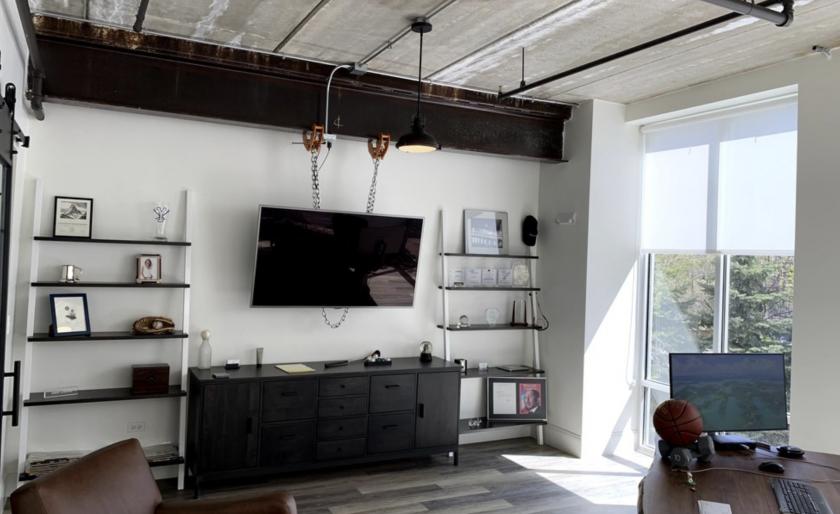
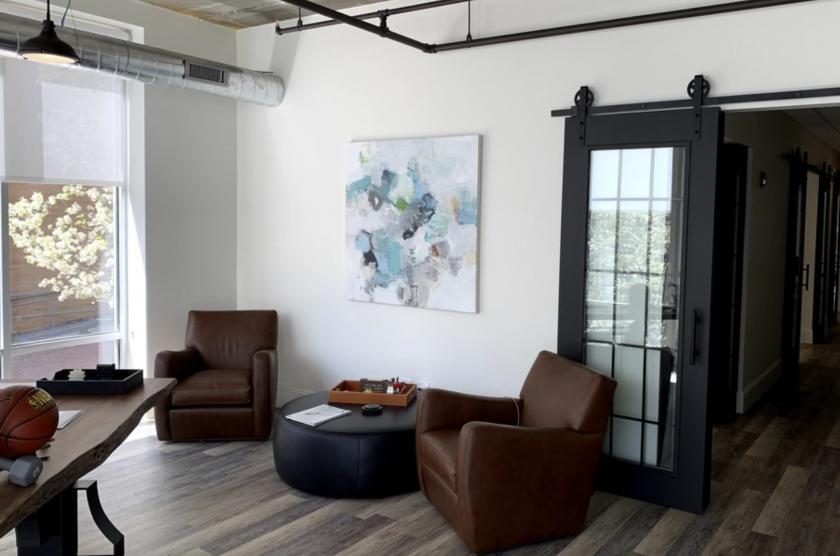
Additional Photos

Listing Agents

Steve Sullivan
O: 847-610-0123
M: 847-610-0123
ssullivan@hiffman.com
O: 847-610-0123
M: 847-610-0123
ssullivan@hiffman.com
While we strive to provide the most accurate information, all listing information, and demographic data, is provided by third-parties. As such, MyEListing will not be responsible for the accuracy of the information. It is strongly recommended that you verify all information with the listing agent, and any relevant agencies, prior to making any decisions.


