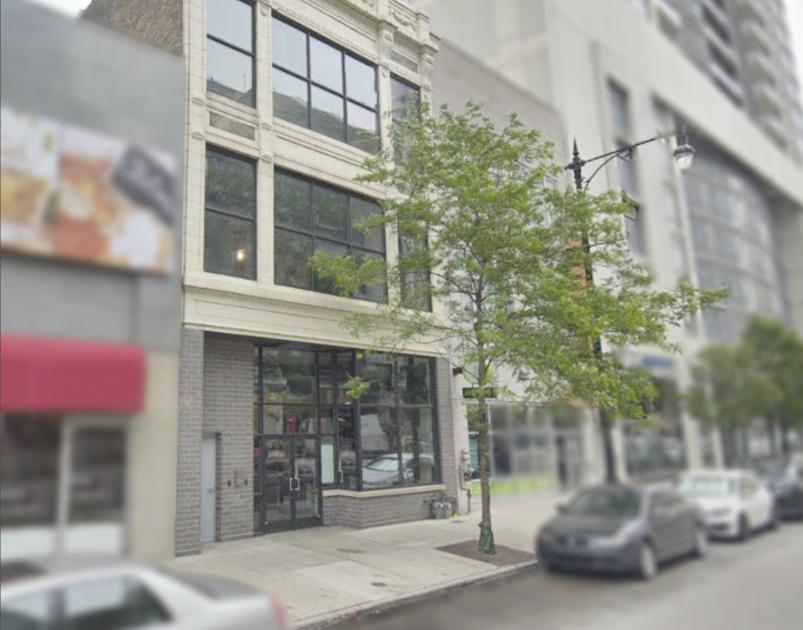
Office Space
1331 South Michigan Avenue Chicago, IL 60605
1331 South Michigan Avenue Chicago, IL 60605
Details & Description
Property Highlights
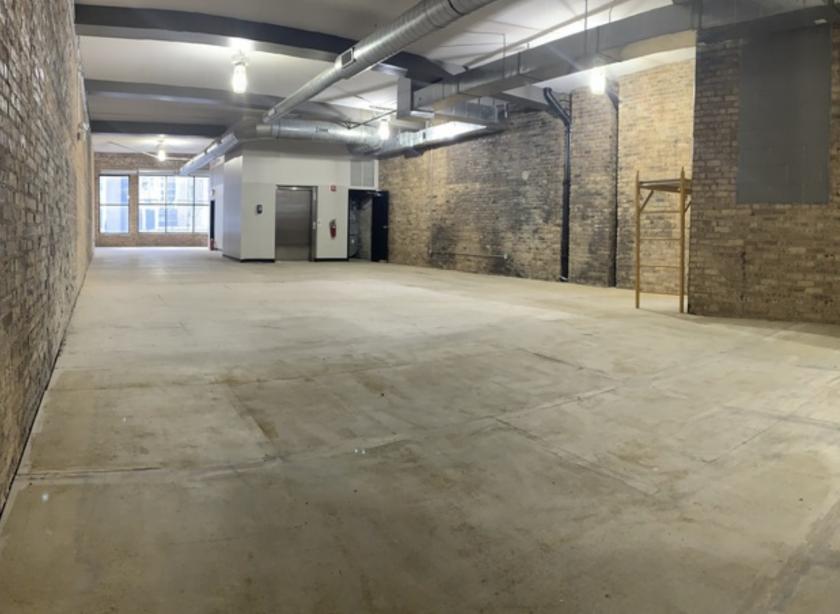
- • 120 - 130 ceiling height
- • 3,000 - 11,700 SF, 3-story mixed use building
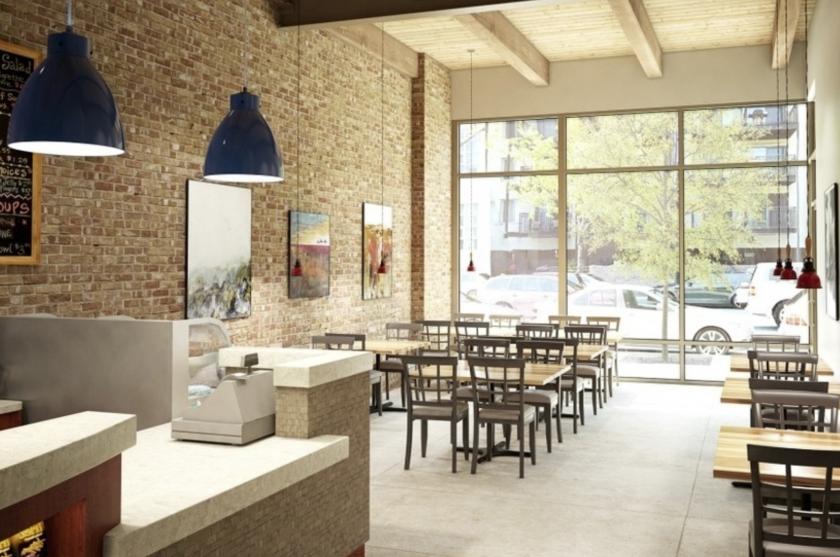
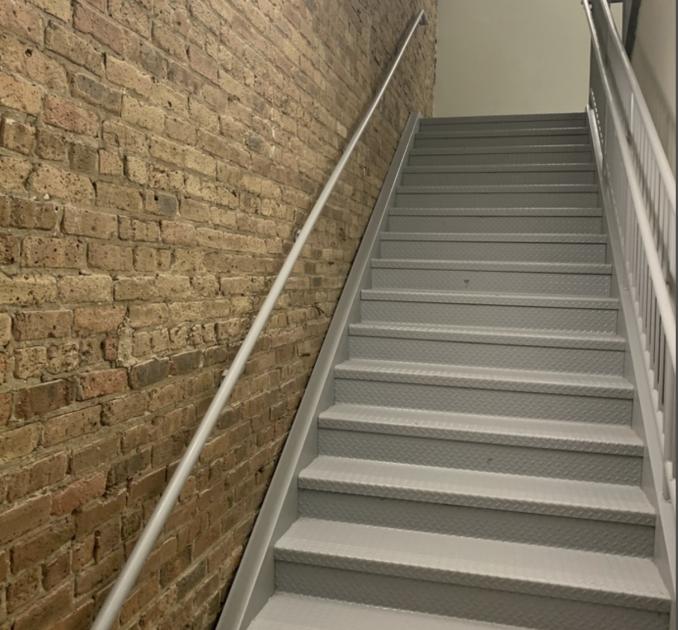
- • Exposed brick walls Column free space
- • Ideal medical, fitness or professional space
Additional Photos

Listing Agents

Steve Sullivan
O: 847-610-0123
M: 847-610-0123
ssullivan@hiffman.com
O: 847-610-0123
M: 847-610-0123
ssullivan@hiffman.com

Kelly Disser
O: 630-317-0721
M: 317-432-4813
kdisser@hiffman.com
O: 630-317-0721
M: 317-432-4813
kdisser@hiffman.com
While we strive to provide the most accurate information, all listing information, and demographic data, is provided by third-parties. As such, MyEListing will not be responsible for the accuracy of the information. It is strongly recommended that you verify all information with the listing agent, and any relevant agencies, prior to making any decisions.


