Office Space
2001 Midwest Road Oak Brook, IL 60523
2001 Midwest Road Oak Brook, IL 60523

Details & Description
Property Highlights
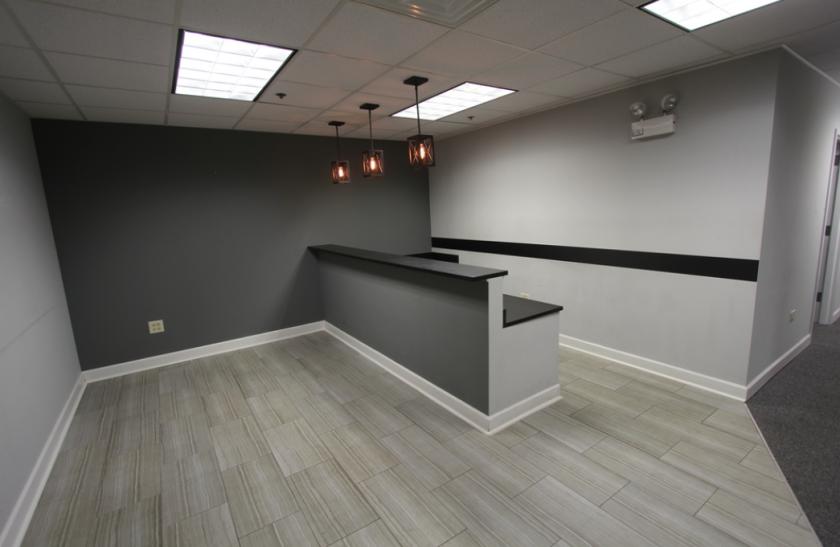
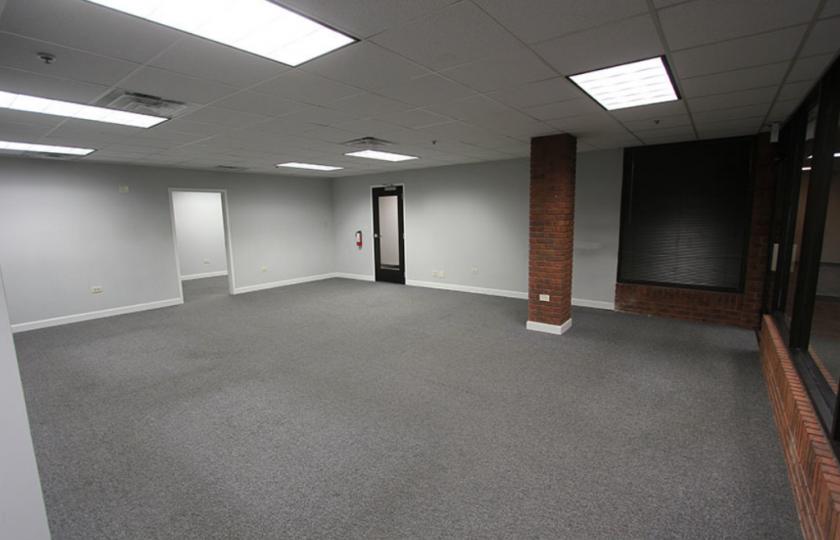
- • 2,137 SF modern medicaltherapy space
- • Large open area
- • File room
- • 6 private roomsoffices
- • Chic reception and lobby area
Listing Agents

Tabitha Dozier
O: 630-693-0676
M: 314-606-4997
tdozier@hiffman.com
O: 630-693-0676
M: 314-606-4997
tdozier@hiffman.com
While we strive to provide the most accurate information, all listing information, and demographic data, is provided by third-parties. As such, MyEListing will not be responsible for the accuracy of the information. It is strongly recommended that you verify all information with the listing agent, and any relevant agencies, prior to making any decisions.