Office Space
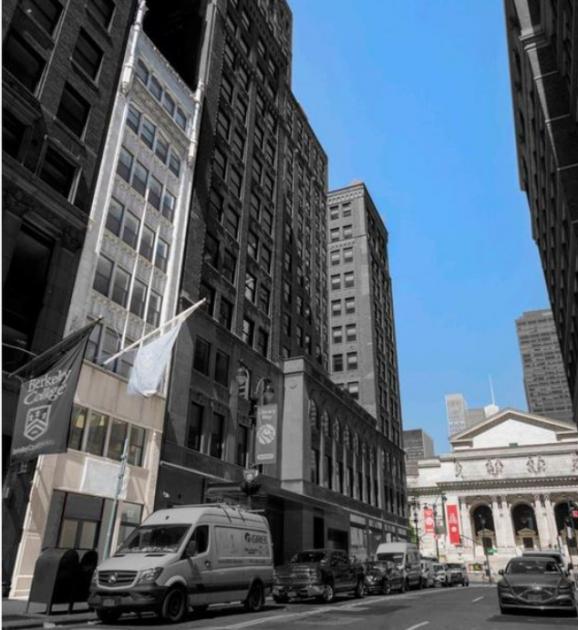
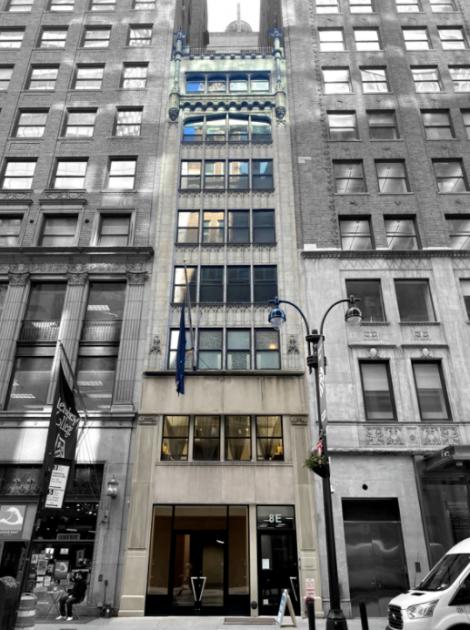
8 East 41st Street New York, NY 10017
8 East 41st Street New York, NY 10017
Details & Description
Property Highlights
• Located in a prime location with walkable access to public transit at Grand Central Terminal, Bryant Park, Times Square
• Several leases turning over allowing the property to be delivered vacant
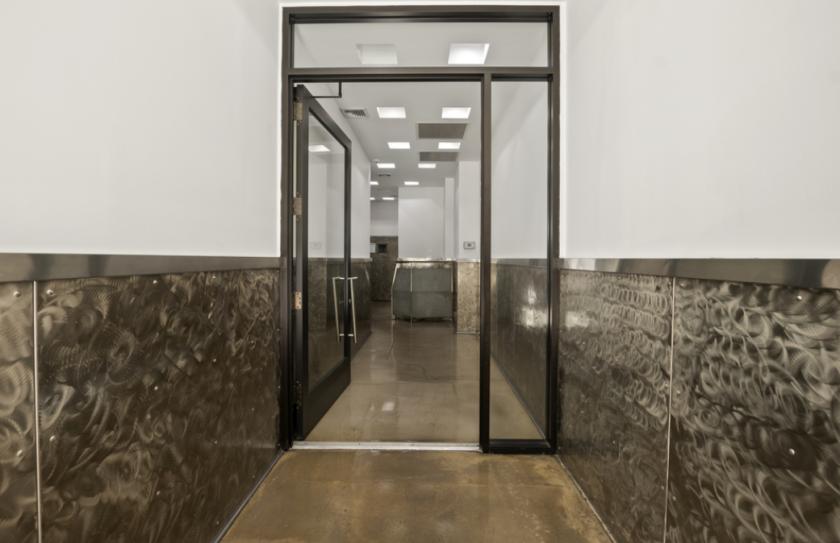
Additional Photos


Listing Agents

Brock Emmetsberger
O: 646-933-2620
brock@b6realestate.com
O: 646-933-2620
brock@b6realestate.com
While we strive to provide the most accurate information, all listing information, and demographic data, is provided by third-parties. As such, MyEListing will not be responsible for the accuracy of the information. It is strongly recommended that you verify all information with the listing agent, and any relevant agencies, prior to making any decisions.


