Office Space
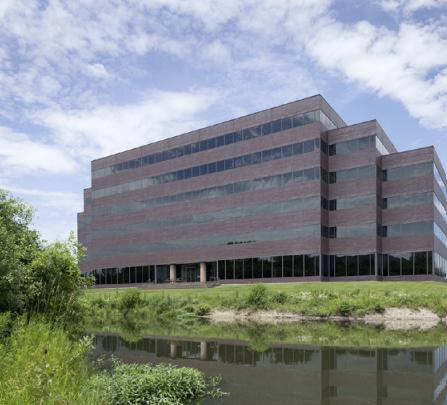
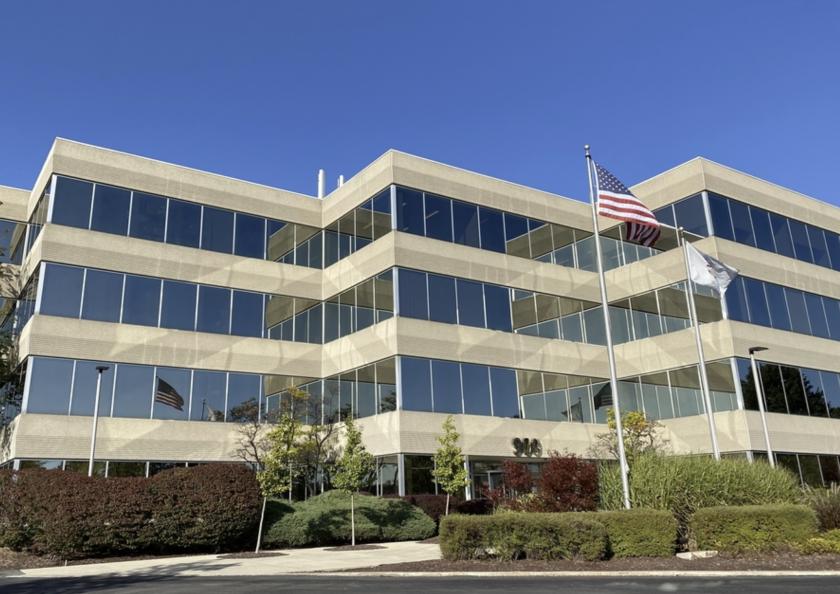
999 Oakmont Plaza Drive Westmont, IL 60559
999 Oakmont Plaza Drive Westmont, IL 60559
Details & Description
Property Highlights
- • BUILDING TOP SIGNAGE AVAILABLE
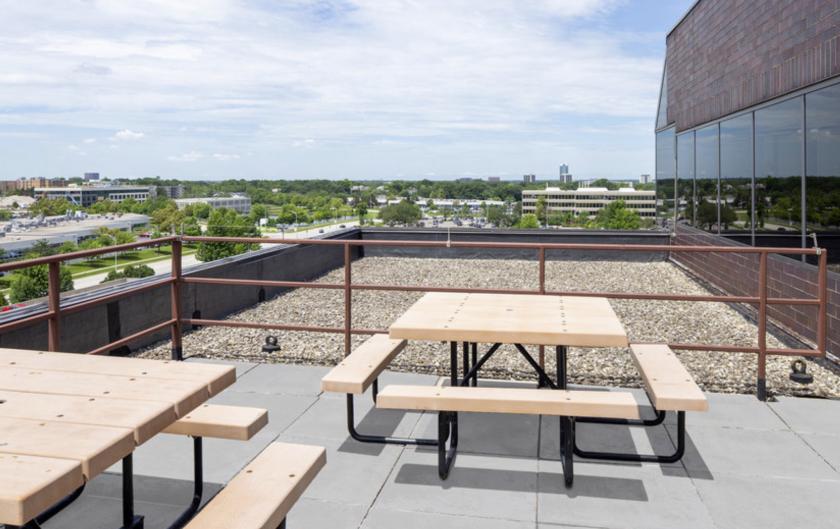
- • Beautifully landscaped grounds with pond views
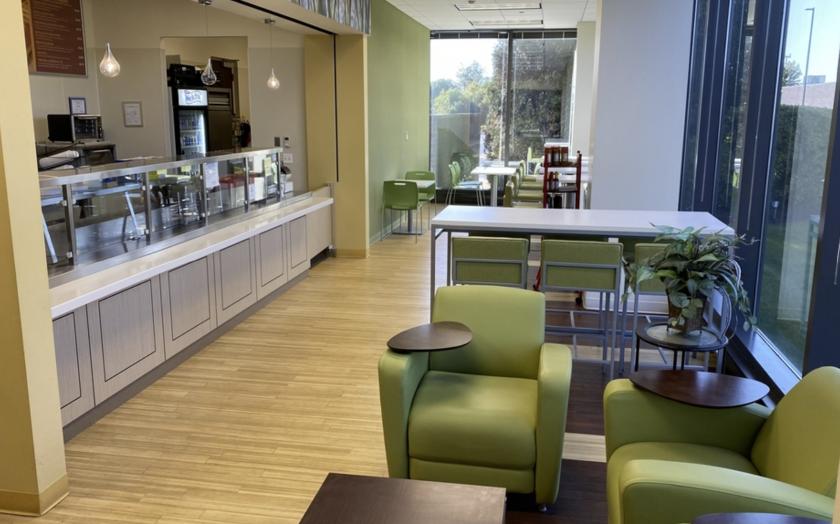
- • New building conference facility
Additional Photos

Listing Agents

Patrick Kiefer
O: 630-693-0670
M: 630-693-0670
pkiefer@hiffman.com
O: 630-693-0670
M: 630-693-0670
pkiefer@hiffman.com
While we strive to provide the most accurate information, all listing information, and demographic data, is provided by third-parties. As such, MyEListing will not be responsible for the accuracy of the information. It is strongly recommended that you verify all information with the listing agent, and any relevant agencies, prior to making any decisions.


