Commercial Land
1310 South Main Street Grove, OK 74344
1310 South Main Street Grove, OK 74344
Details & Description
Property Highlights
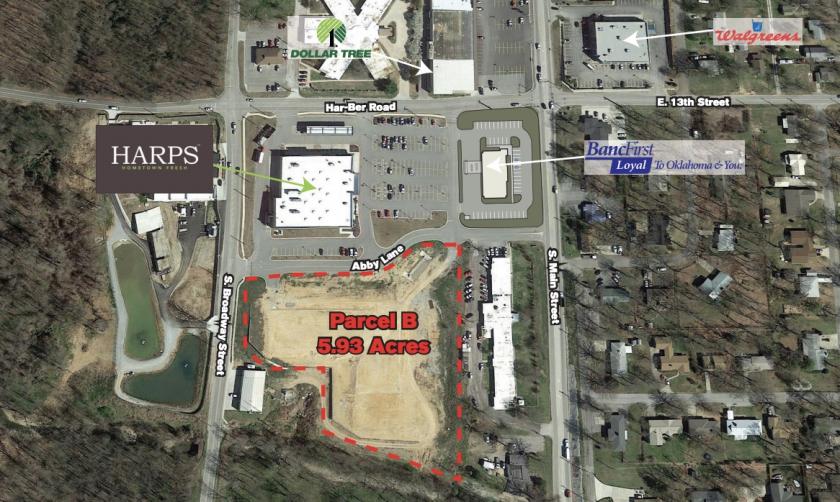
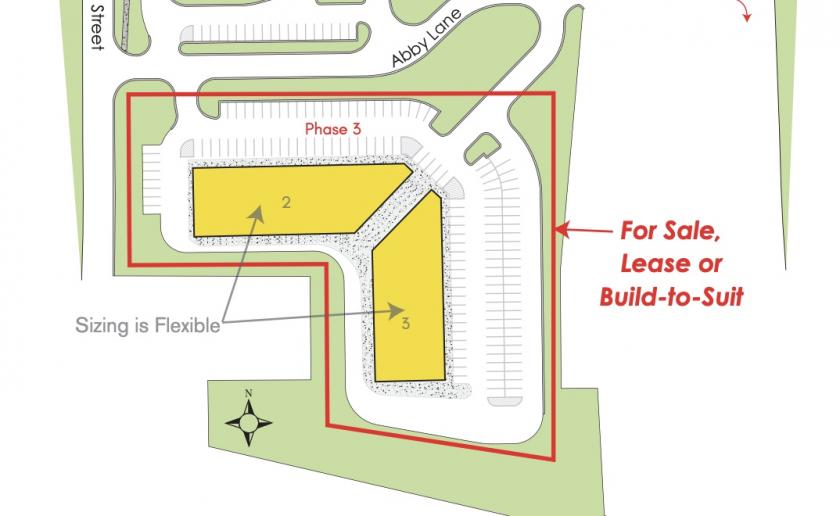
- • 1 Parcel available for Sale or Ground Lease
- • Build to Suit options available
- • All utilities to site
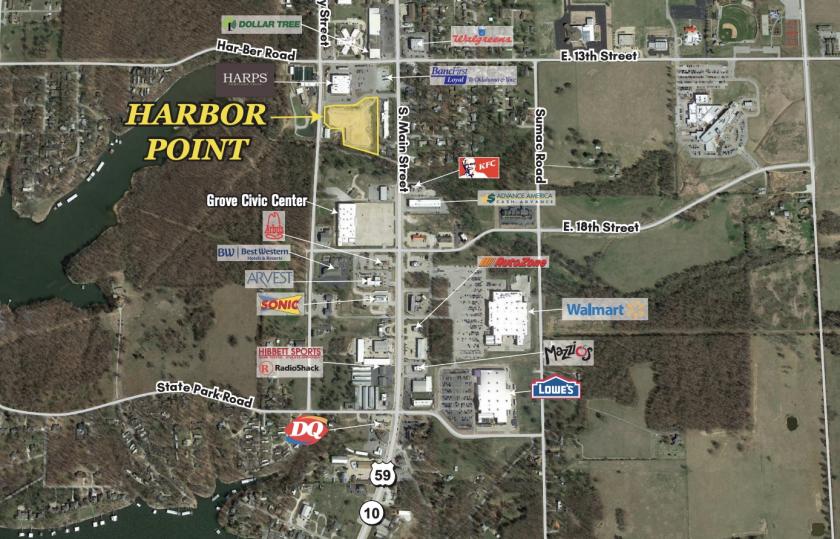
- • Adjacent to Harps
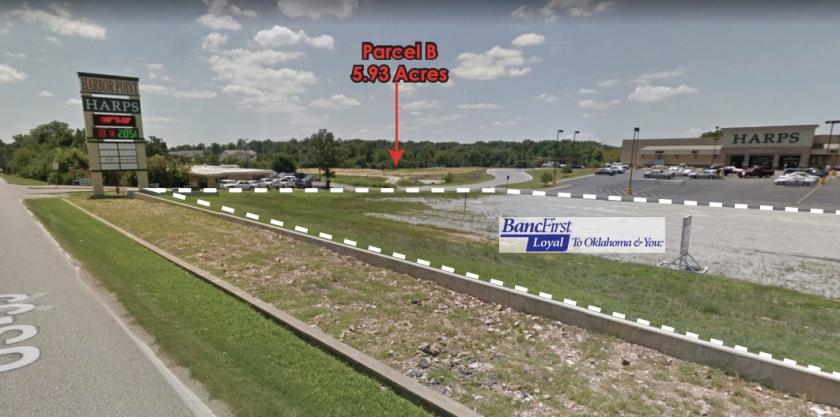
Additional Photos
Listing Agents

Raymond Hicks
O: 757-627-9088
M: 757-434-1168
rhicks@whlr.us
O: 757-627-9088
M: 757-434-1168
rhicks@whlr.us
While we strive to provide the most accurate information, all listing information, and demographic data, is provided by third-parties. As such, MyEListing will not be responsible for the accuracy of the information. It is strongly recommended that you verify all information with the listing agent, and any relevant agencies, prior to making any decisions.


