Industrial Properties
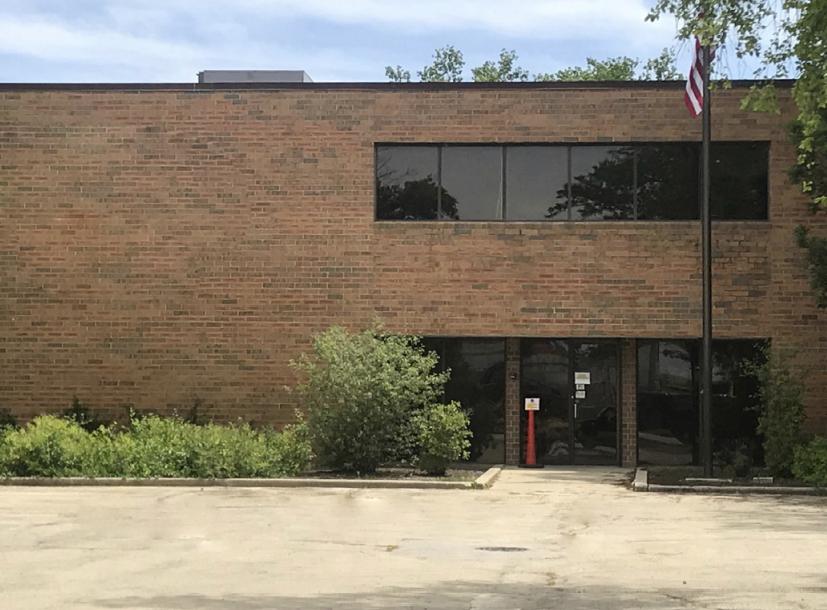
1797 North La Fox Street South Elgin, IL 60177
1797 North La Fox Street South Elgin, IL 60177

Details & Description
Property Highlights
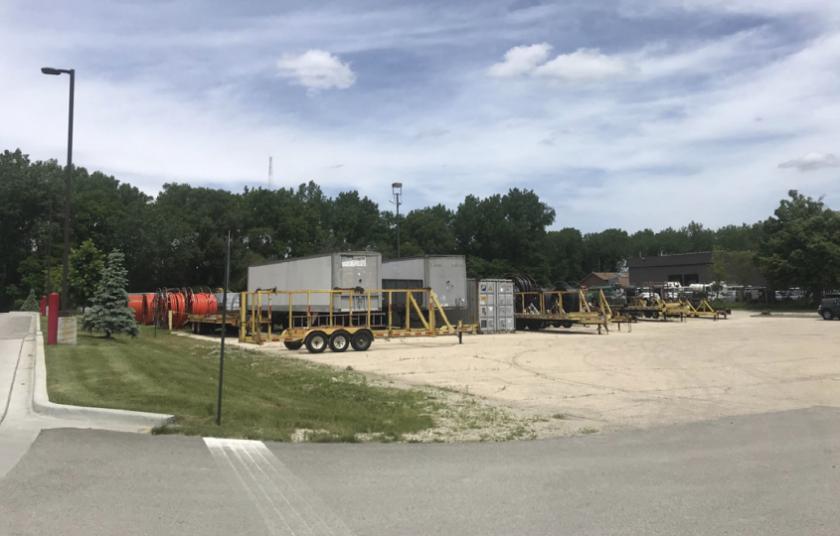
• Ample Space For Outdoor Storage, Parking, Possible Building Expansion
• GREAT POTENTIAL FOR RESIDENTIAL, RECREATIONAL, OR INDUSTRIAL USE
Additional Photos

Listing Agents

Bruce Granger
O: 630-693-0648
M: 708-987-0811
bgranger@hiffman.com
O: 630-693-0648
M: 708-987-0811
bgranger@hiffman.com

Steven Bass
O: 630-317-0738
M: 773-426-7227
sbass@hiffman.com
O: 630-317-0738
M: 773-426-7227
sbass@hiffman.com
While we strive to provide the most accurate information, all listing information, and demographic data, is provided by third-parties. As such, MyEListing will not be responsible for the accuracy of the information. It is strongly recommended that you verify all information with the listing agent, and any relevant agencies, prior to making any decisions.


