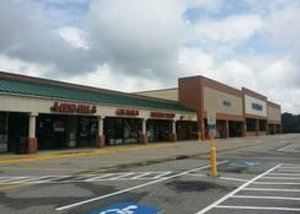
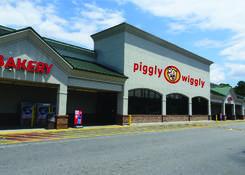
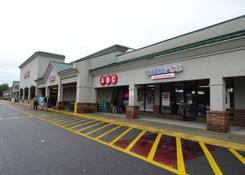
1-Mile | 3-Miles | 5-Miles | ||
---|---|---|---|---|
Total Population | 3,241 | 52,745 | 176,198 | |
Population Median Age | 36 | 36 | 36 | |
Population by Age | 0-9 Yrs | 334 (10%) | 7435 (14%) | 24454 (13%) |
10-19 Yrs | 586 (18%) | 7783 (14%) | 23252 (13%) | |
20-29 Yrs | 480 (14%) | 7695 (14%) | 26381 (14%) | |
30-39 Yrs | 446 (13%) | 7899 (14%) | 26438 (15%) | |
40-49 Yrs | 362 (11%) | 6176 (11%) | 22624 (12%) | |
50-59 Yrs | 516 (15%) | 6812 (12%) | 22232 (12%) | |
60-69 Yrs | 288 (8%) | 4752 (9%) | 17028 (9%) | |
70+ Yrs | 229 (7%) | 4195 (7%) | 13791 (7%) | |
Median HH Income | $62,704 | $62,677 | $59,376 | |
Total Household Income | < 24K | 212 (18%) | 2987 (15%) | 11032 (17%) |
25-49K | 272 (23%) | 4206 (22%) | 14635 (22%) | |
50-74K | 203 (17%) | 3994 (21%) | 14247 (22%) | |
75-99K | 194 (16%) | 3033 (16%) | 10131 (15%) | |
100-199K | 199 (17%) | 3774 (20%) | 11732 (18%) | |
200K+ | 64 (5%) | 731 (3%) | 1947 (3%) | |
Highest Education Level | No Diploma | 271 | 3352 | 12284 |
Diploma or GED | 680 | 9905 | 33849 | |
Some College | 453 | 8275 | 28607 | |
Assoc. Degree | 278 | 4326 | 13634 | |
Bachelors Degree | 266 | 5723 | 19282 | |
Higher Degree | 142 | 2431 | 8718 | |
Total Housing Units | 1,222 | 20,261 | 68,683 | |
--Owner-Occupied | 815 | 12,640 | 40,706 | |
--Renter-Occupied | 331 | 6,084 | 23,018 | |
Owner-Occupied Values | < 100K | 178 | 1719 | 5377 |
100-199K | 264 | 5853 | 19871 | |
200-299K | 202 | 3684 | 11395 | |
300-399K | 96 | 864 | 2677 | |
400-499K | 50 | 299 | 682 | |
500K+ | 25 | 221 | 704 | |
Total Working Age Population | 2,554 | 40,814 | 137,574 | |
In Work Force | 1,640 | 27,251 | 92,590 | |
Not In Work Force | 913 | 13,563 | 44,984 | |
Workforce Employed | 1,455 | 25,155 | 86,018 | |
Workforce Unemployed | 120 | 1,277 | 4,477 | |
Civlian Workforce | 1,576 | 26,431 | 90,495 | |
Military Workforce | 65 | 819 | 2,095 | |
Total Households | 1,146 | 18,724 | 63,724 | |
Family Households | 786 | 12,781 | 42,635 | |
Non-Family Households | 360 | 5,944 | 21,089 | |
Married Couple | 512 | 8,700 | 29,362 | |
Other Family | 274 | 4,081 | 13,273 | |
Married w/Child | 206 | 3,591 | 11,437 | |
Single Male w/Child | 28 | 510 | 1,436 | |
Single Female w/Child | 89 | 1,701 | 5,739 |
Population Change Last Two Decades - Plus Projection
2000 | % | 2010 | % | 2020 | % | 2030 | |
---|---|---|---|---|---|---|---|
South Carolina | 4,012,012 | +15 | 4,625,364 | +9 | 5,020,400 | +9 | 5,488,460 |
Berkeley County | 142,651 | +25 | 177,843 | +8 | 192,450 | +11 | 214,140 |
Charleston County | 309,969 | +13 | 350,209 | +5 | 366,380 | +6 | 386,660 |
Dorchester County | 96,413 | +42 | 136,555 | +9 | 149,300 | +14 | 170,210 |
Total Working Age Population:
Total Households:
Total Working Age Population:
Total Households:
Total Working Age Population:
Total Households: