Retail Space
115 Willbrook Boulevard Pawleys Island, SC 29585
115 Willbrook Boulevard Pawleys Island, SC 29585

Details & Description
Property Highlights
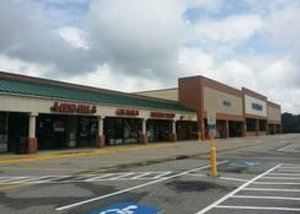
• Anchored by Food Lion on Highway 17, the highly trafficked and main commercial thoroughfare along the Atlantic Ocean.
• Additional tenants include Pawleys Island Pharmacy, Edward Jones, Eggs Up Grill, Masseys Pizza, and Anytime Fitness.
Additional Photos


Listing Agents

Kevin Conway
O: 757-627-9088
M: 757-618-5932
kconway@whlr.us
O: 757-627-9088
M: 757-618-5932
kconway@whlr.us
While we strive to provide the most accurate information, all listing information, and demographic data, is provided by third-parties. As such, MyEListing will not be responsible for the accuracy of the information. It is strongly recommended that you verify all information with the listing agent, and any relevant agencies, prior to making any decisions.