Industrial Properties
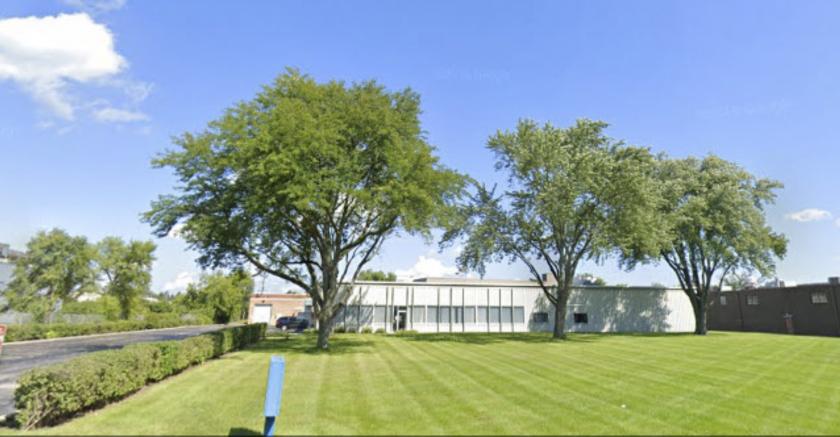
1300 Abbott Drive Elgin, IL 60123
1300 Abbott Drive Elgin, IL 60123
Details & Description
Property Highlights
- • 51,123 SF available for sale or lease
- • 1 interior dock
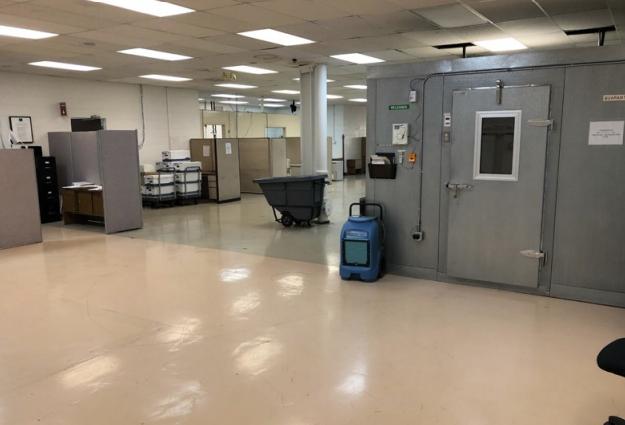
- • Existing Class 3 clean room
- • Low Kane County taxes
- • 14 clear height
- • 2 drive-in doors 10w x 12h
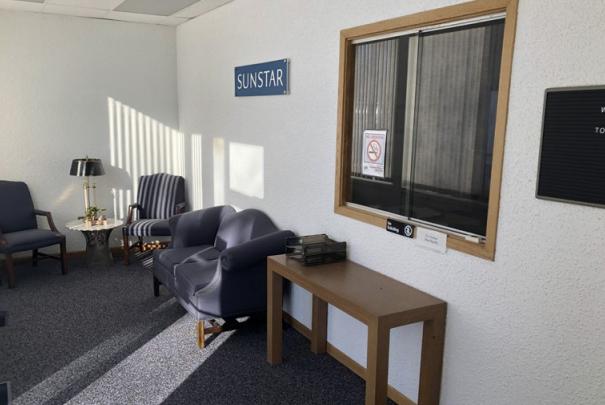
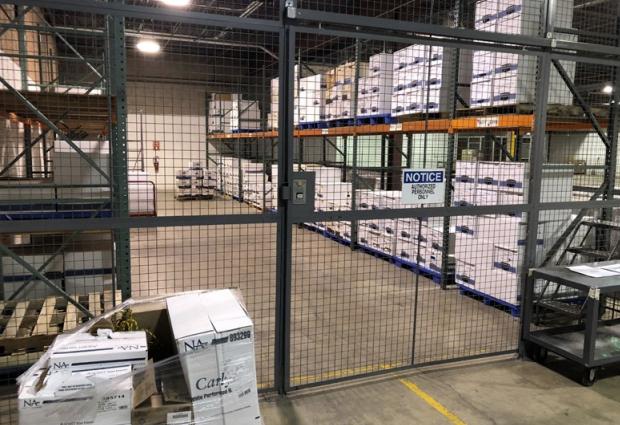
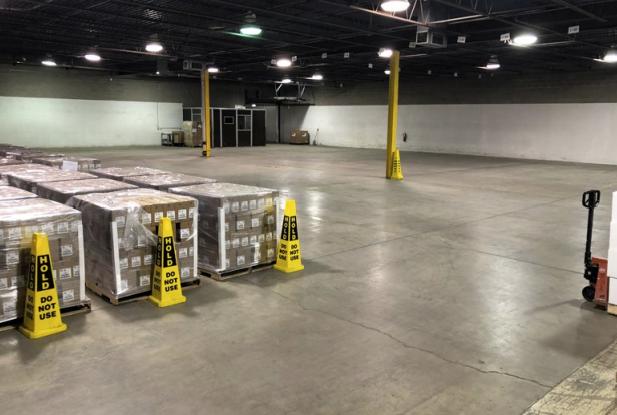
Additional Photos
Listing Agents

David Haigh
O: 630-693-0649
M: 630-525-0649
dhaigh@hiffman.com
O: 630-693-0649
M: 630-525-0649
dhaigh@hiffman.com
While we strive to provide the most accurate information, all listing information, and demographic data, is provided by third-parties. As such, MyEListing will not be responsible for the accuracy of the information. It is strongly recommended that you verify all information with the listing agent, and any relevant agencies, prior to making any decisions.


