Industrial Properties
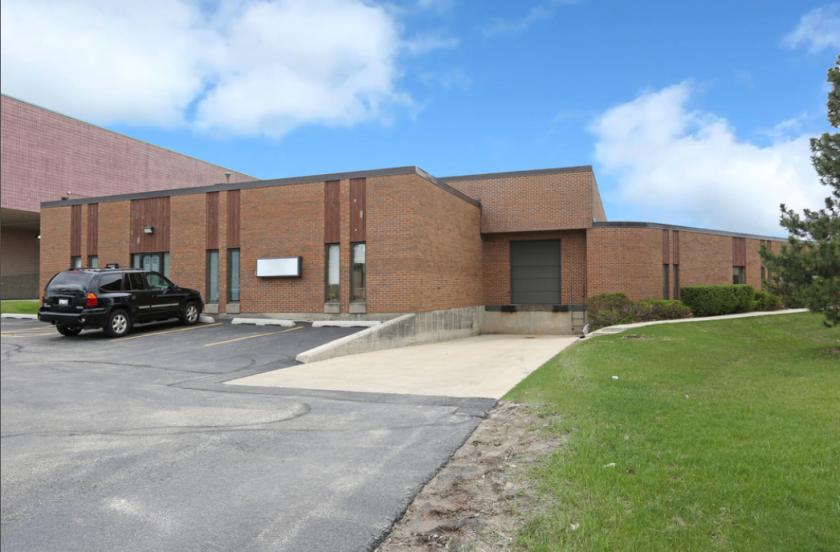
1503 Brook Drive Downers Grove, IL 60515
1503 Brook Drive Downers Grove, IL 60515
Details & Description
Property Highlights
- • High-demand central DuPage location
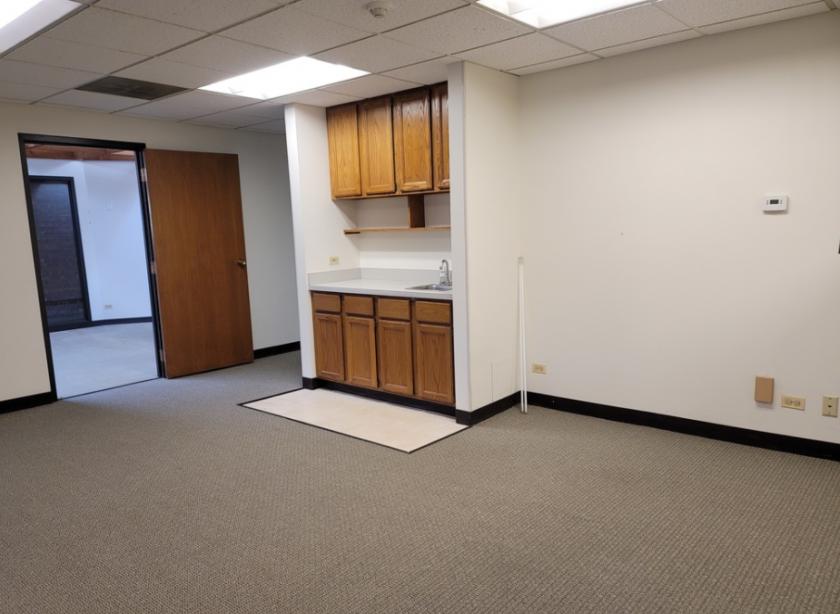
- • Well maintained offices
- • Units can be combined
- • Great access to I-355 and I-88
- • Close proximity to high-end retail
- • Mezzanine warehouse storage
Listing Agents

Joe Bronson
O: 630-317-0725
M: 708-308-1155
jbronson@hiffman.com
O: 630-317-0725
M: 708-308-1155
jbronson@hiffman.com

Josh Will
NAI Hiffman
O: 630-317-0794
M: 630-317-0794
jwill@hiffman.com
NAI Hiffman
O: 630-317-0794
M: 630-317-0794
jwill@hiffman.com

Aimee Goudas
HAI Hiffman
O: 630-317-0714
M: 617-939-7944
agoudas@hiffman.com
HAI Hiffman
O: 630-317-0714
M: 617-939-7944
agoudas@hiffman.com
While we strive to provide the most accurate information, all listing information, and demographic data, is provided by third-parties. As such, MyEListing will not be responsible for the accuracy of the information. It is strongly recommended that you verify all information with the listing agent, and any relevant agencies, prior to making any decisions.