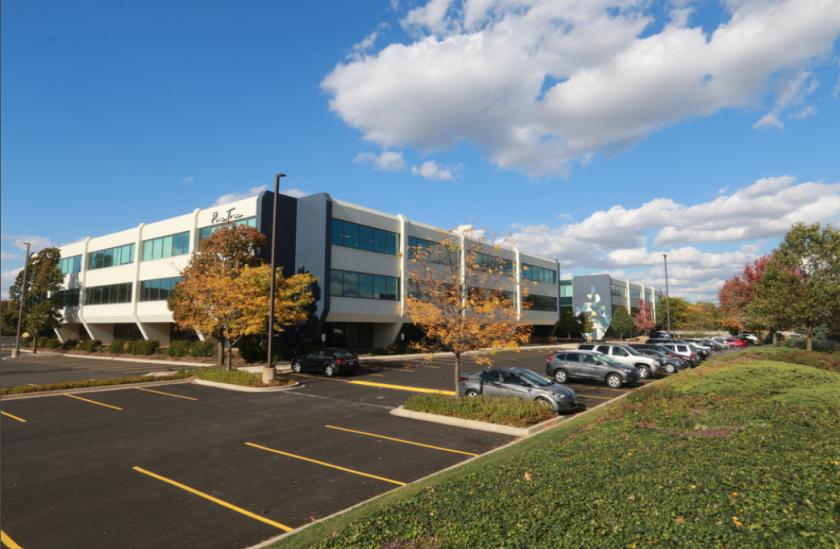
Office Space
814 Commerce Drive Oak Brook, IL 60523
814 Commerce Drive Oak Brook, IL 60523
Details & Description
Property Highlights
- • Space available ranges from 4,522 to 45,722 SF
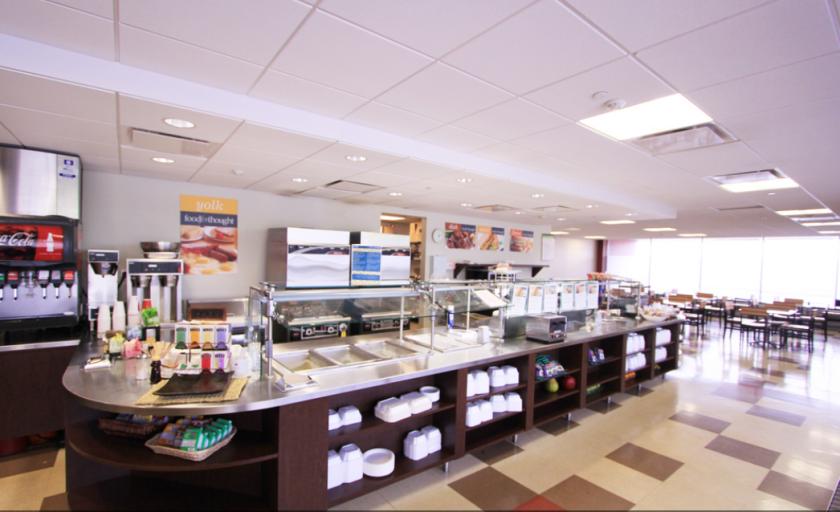
- • Full service deli
- • 1500 KW 277 volt 480 diesel generator available
- • Superior access to OHare and Midway Airports
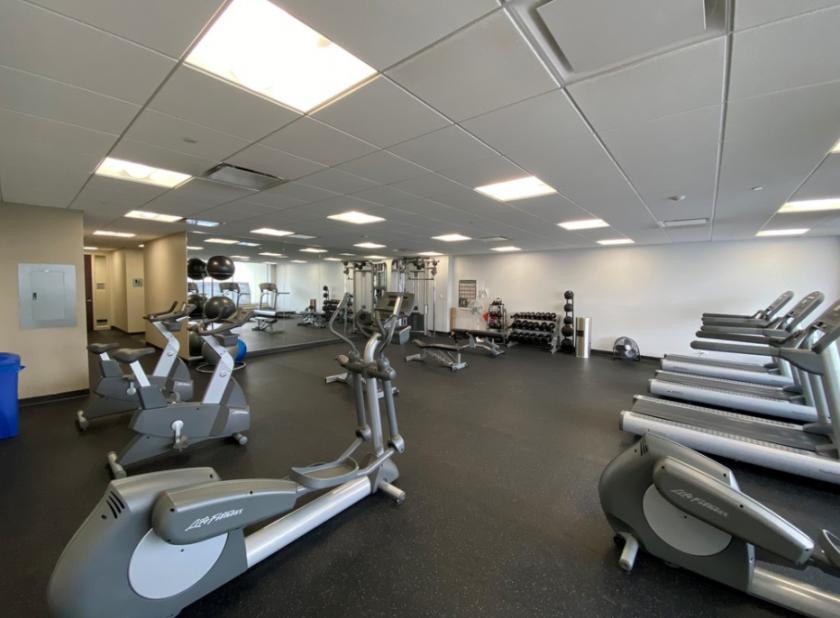
- • On-site full service fitness center
Listing Agents

Jim Adler
O: 630-691-0605
M: 630-745-7042
jadler@hiffman.com
O: 630-691-0605
M: 630-745-7042
jadler@hiffman.com
While we strive to provide the most accurate information, all listing information, and demographic data, is provided by third-parties. As such, MyEListing will not be responsible for the accuracy of the information. It is strongly recommended that you verify all information with the listing agent, and any relevant agencies, prior to making any decisions.