Industrial Properties
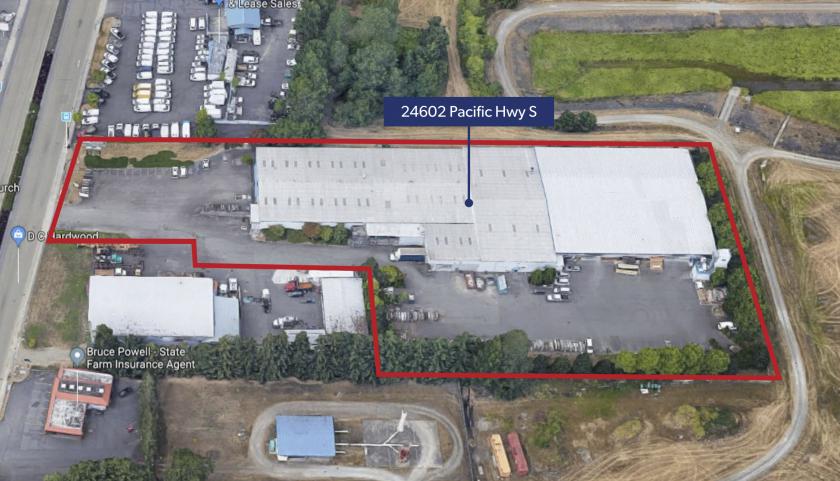
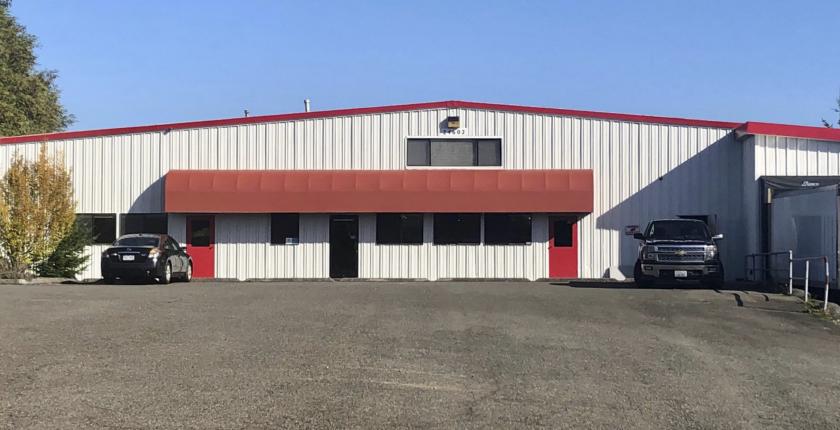
24602 Pacific Highway South Kent, WA 98032
24602 Pacific Highway South Kent, WA 98032
Details & Description
Listing Agents

Jeff Crane
O: 206-336-5336
jcrane@andoverco.com
O: 206-336-5336
jcrane@andoverco.com

Veronika Zwicke
The Andover Company Inc.
O: 206-336-5335
vzwicke@andoverco.com
The Andover Company Inc.
O: 206-336-5335
vzwicke@andoverco.com
While we strive to provide the most accurate information, all listing information, and demographic data, is provided by third-parties. As such, MyEListing will not be responsible for the accuracy of the information. It is strongly recommended that you verify all information with the listing agent, and any relevant agencies, prior to making any decisions.