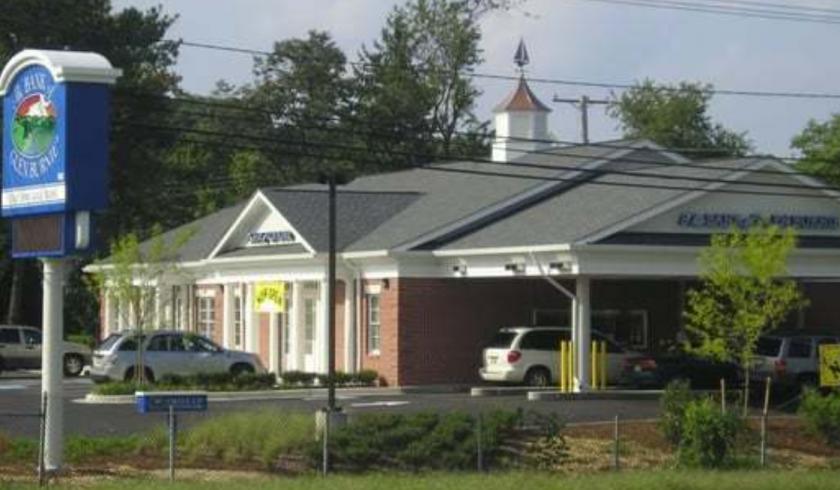
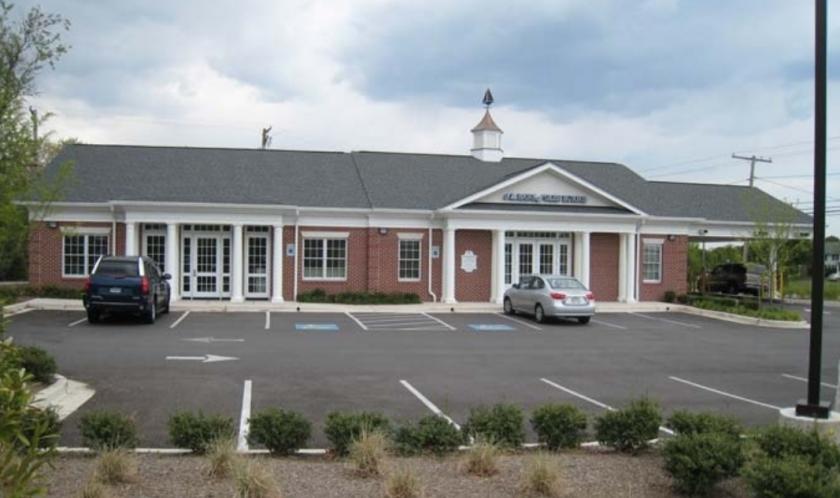
1-Mile | 3-Miles | 5-Miles | ||
---|---|---|---|---|
Total Population | 11,385 | 73,378 | 184,750 | |
Population Median Age | 36 | 38 | 38 | |
Population by Age | 0-9 Yrs | 1607 (14%) | 9156 (12%) | 23941 (12%) |
10-19 Yrs | 1321 (11%) | 9542 (13%) | 23300 (12%) | |
20-29 Yrs | 1940 (17%) | 10510 (14%) | 25654 (13%) | |
30-39 Yrs | 1828 (16%) | 9983 (13%) | 26612 (14%) | |
40-49 Yrs | 1494 (13%) | 9534 (12%) | 25209 (13%) | |
50-59 Yrs | 1355 (11%) | 10613 (14%) | 26727 (14%) | |
60-69 Yrs | 968 (8%) | 8001 (10%) | 17736 (9%) | |
70+ Yrs | 871 (7%) | 6041 (8%) | 15571 (8%) | |
Median HH Income | $66,601 | $86,655 | $90,169 | |
Total Household Income | < 24K | 656 (13%) | 2972 (10%) | 6911 (10%) |
25-49K | 1001 (20%) | 4501 (16%) | 10438 (15%) | |
50-74K | 1118 (23%) | 4433 (16%) | 11134 (16%) | |
75-99K | 726 (15%) | 3643 (13%) | 9592 (13%) | |
100-199K | 1057 (22%) | 8592 (31%) | 22546 (32%) | |
200K+ | 228 (4%) | 3068 (11%) | 7986 (11%) | |
Highest Education Level | No Diploma | 809 | 4463 | 10665 |
Diploma or GED | 2030 | 14082 | 33293 | |
Some College | 1715 | 10433 | 25641 | |
Assoc. Degree | 791 | 4229 | 10747 | |
Bachelors Degree | 1483 | 10035 | 26997 | |
Higher Degree | 750 | 6400 | 18162 | |
Total Housing Units | 5,085 | 29,367 | 73,159 | |
--Owner-Occupied | 2,127 | 17,883 | 47,439 | |
--Renter-Occupied | 2,659 | 9,327 | 21,167 | |
Owner-Occupied Values | < 100K | 82 | 467 | 1478 |
100-199K | 434 | 2123 | 4165 | |
200-299K | 789 | 5948 | 15573 | |
300-399K | 437 | 4464 | 12541 | |
400-499K | 191 | 1903 | 5875 | |
500K+ | 195 | 2977 | 7809 | |
Total Working Age Population | 9,042 | 58,589 | 146,455 | |
In Work Force | 6,588 | 41,568 | 103,939 | |
Not In Work Force | 2,454 | 17,022 | 42,516 | |
Workforce Employed | 6,059 | 39,258 | 96,805 | |
Workforce Unemployed | 402 | 1,752 | 4,394 | |
Civlian Workforce | 6,462 | 41,011 | 101,199 | |
Military Workforce | 126 | 557 | 2,740 | |
Total Households | 4,786 | 27,210 | 68,606 | |
Family Households | 2,910 | 18,926 | 47,863 | |
Non-Family Households | 1,876 | 8,283 | 20,744 | |
Married Couple | 1,813 | 13,880 | 35,243 | |
Other Family | 1,097 | 5,046 | 12,620 | |
Married w/Child | 778 | 5,687 | 14,788 | |
Single Male w/Child | 71 | 425 | 1,475 | |
Single Female w/Child | 625 | 2,008 | 4,530 |
Population Change Last Two Decades - Plus Projection
2000 | % | 2010 | % | 2020 | % | 2030 | |
---|---|---|---|---|---|---|---|
Maryland | 5,296,486 | +9 | 5,773,552 | +6 | 6,141,900 | +6 | 6,518,750 |
Anne Arundel County | 489,656 | +10 | 537,656 | +7 | 573,250 | +4 | 596,700 |
Baltimore County | 754,292 | +7 | 805,029 | +5 | 847,000 | +2 | 862,200 |
Howard County | 247,842 | +16 | 287,085 | +17 | 336,900 | +9 | 366,800 |
Prince Georges County | 801,515 | +8 | 863,420 | +6 | 916,150 | +4 | 952,950 |
Baltimore city | 651,154 | -5 | 620,961 | -1 | 616,300 | +1 | 625,100 |
Total Working Age Population:
Total Households:
Total Working Age Population:
Total Households:
Total Working Age Population:
Total Households: