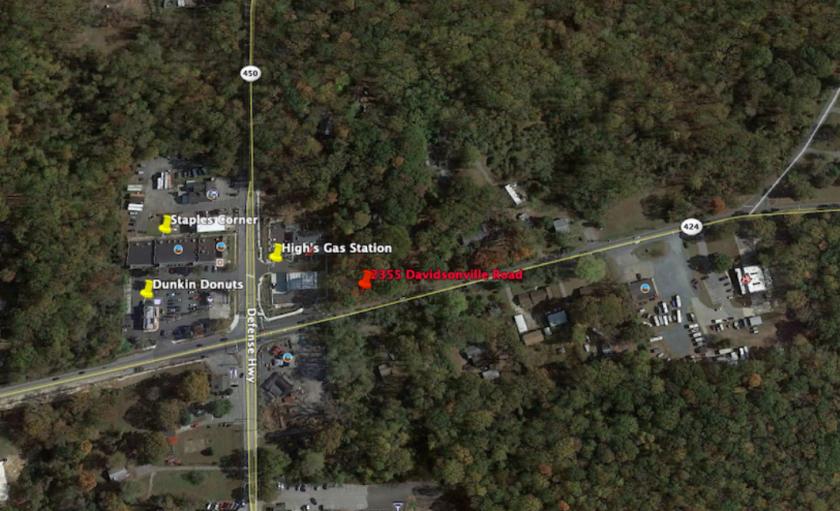
1-Mile | 3-Miles | 5-Miles | ||
---|---|---|---|---|
Total Population | 4,823 | 35,433 | 88,751 | |
Population Median Age | 39 | 37 | 41 | |
Population by Age | 0-9 Yrs | 655 (13%) | 4875 (13%) | 10881 (12%) |
10-19 Yrs | 711 (14%) | 5110 (14%) | 11152 (12%) | |
20-29 Yrs | 521 (10%) | 3597 (10%) | 8563 (9%) | |
30-39 Yrs | 634 (13%) | 5418 (15%) | 11805 (13%) | |
40-49 Yrs | 600 (12%) | 5096 (14%) | 12009 (13%) | |
50-59 Yrs | 552 (11%) | 4672 (13%) | 13358 (15%) | |
60-69 Yrs | 595 (12%) | 3782 (10%) | 9796 (11%) | |
70+ Yrs | 555 (11%) | 2883 (8%) | 11187 (12%) | |
Median HH Income | $141,398 | $125,208 | $116,558 | |
Total Household Income | < 24K | 27 (1%) | 372 (2%) | 1938 (5%) |
25-49K | 89 (5%) | 942 (7%) | 3121 (9%) | |
50-74K | 120 (7%) | 1334 (10%) | 3837 (11%) | |
75-99K | 149 (9%) | 1673 (13%) | 4304 (13%) | |
100-199K | 747 (46%) | 5571 (44%) | 13827 (41%) | |
200K+ | 477 (29%) | 2720 (21%) | 5934 (18%) | |
Highest Education Level | No Diploma | 115 | 932 | 2788 |
Diploma or GED | 453 | 3619 | 11599 | |
Some College | 554 | 4004 | 11655 | |
Assoc. Degree | 226 | 1733 | 4327 | |
Bachelors Degree | 910 | 7460 | 17431 | |
Higher Degree | 923 | 6219 | 15146 | |
Total Housing Units | 1,618 | 13,021 | 34,389 | |
--Owner-Occupied | 1,436 | 10,325 | 27,038 | |
--Renter-Occupied | 172 | 2,287 | 5,923 | |
Owner-Occupied Values | < 100K | 13 | 70 | 405 |
100-199K | 5 | 343 | 1040 | |
200-299K | 259 | 2362 | 6461 | |
300-399K | 115 | 2134 | 8549 | |
400-499K | 415 | 1603 | 3749 | |
500K+ | 629 | 3811 | 6833 | |
Total Working Age Population | 3,725 | 27,162 | 70,635 | |
In Work Force | 2,648 | 20,123 | 48,477 | |
Not In Work Force | 1,077 | 7,039 | 22,158 | |
Workforce Employed | 2,502 | 19,006 | 45,572 | |
Workforce Unemployed | 114 | 638 | 1,832 | |
Civlian Workforce | 2,616 | 19,644 | 47,403 | |
Military Workforce | 32 | 480 | 1,074 | |
Total Households | 1,607 | 12,611 | 32,961 | |
Family Households | 1,372 | 9,762 | 23,471 | |
Non-Family Households | 236 | 2,849 | 9,490 | |
Married Couple | 1,144 | 7,758 | 18,567 | |
Other Family | 228 | 2,004 | 4,904 | |
Married w/Child | 478 | 3,608 | 7,703 | |
Single Male w/Child | 66 | 391 | 747 | |
Single Female w/Child | 62 | 803 | 1,634 |
Population Change Last Two Decades - Plus Projection
2000 | % | 2010 | % | 2020 | % | 2030 | |
---|---|---|---|---|---|---|---|
Maryland | 5,296,486 | +9 | 5,773,552 | +6 | 6,141,900 | +6 | 6,518,750 |
Anne Arundel County | 489,656 | +10 | 537,656 | +7 | 573,250 | +4 | 596,700 |
Prince Georges County | 801,515 | +8 | 863,420 | +6 | 916,150 | +4 | 952,950 |
Total Working Age Population:
Total Households:
Total Working Age Population:
Total Households:
Total Working Age Population:
Total Households: