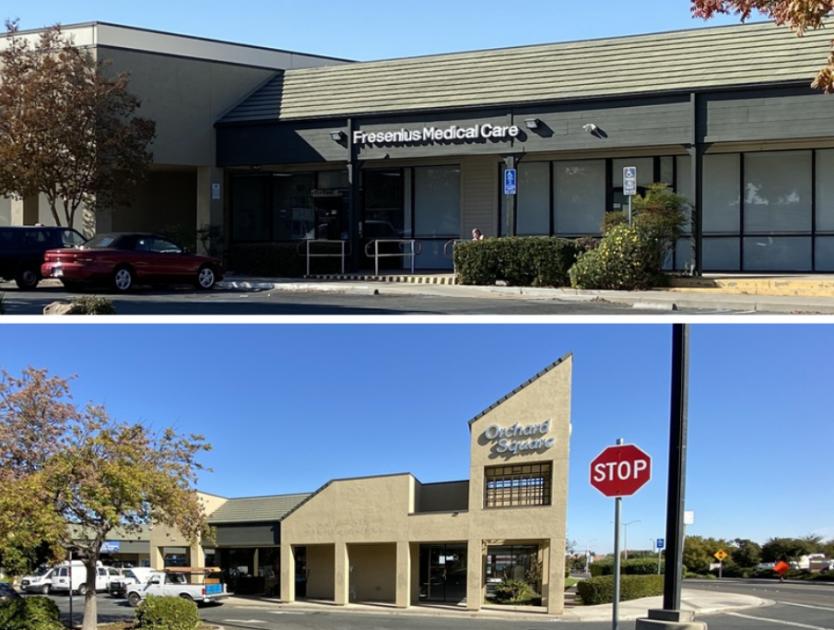
Retail Space
2334 Buchanan Road Antioch, CA 94509
2334 Buchanan Road Antioch, CA 94509
Details & Description
Property Highlights
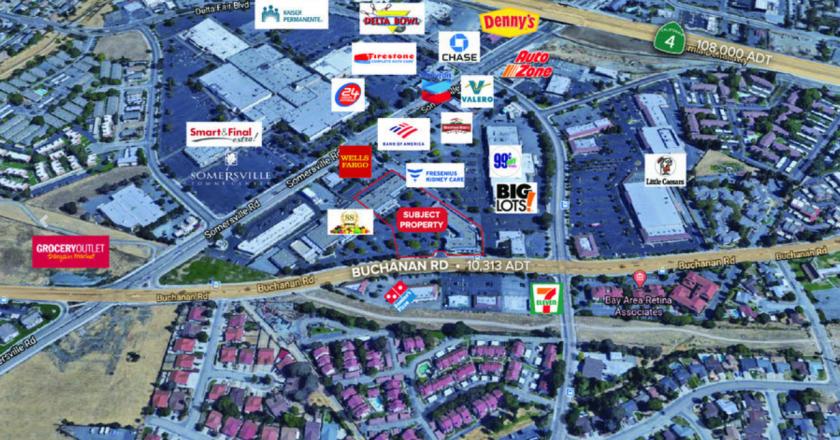
• Adjacent property, 2388 Buchanan Rd not included in the sale, will have new grocery anchor 88 Supermarket coming
• Close proximity to CA Hwy 4, with frontage on Buchanan Rd, nestled between Delta Faire Blvd and Somersville Rd
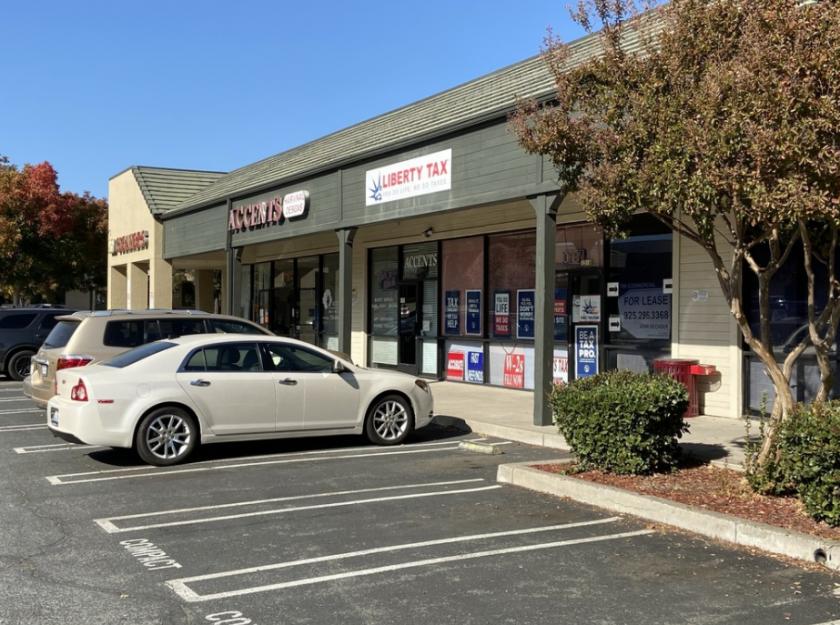
Additional Photos


Listing Agents

Timothy Richardson
O: 510-356-2970
trichardson@nainorcal.com
O: 510-356-2970
trichardson@nainorcal.com

Joshua Ballesteros
O: 415-480-0214
M: 209-518-9025
jballesteros@nainorcal.com
O: 415-480-0214
M: 209-518-9025
jballesteros@nainorcal.com

Nick Cole
NAI - Northern California
O: 510-250-7750
ncole@nainorcal.com
NAI - Northern California
O: 510-250-7750
ncole@nainorcal.com
While we strive to provide the most accurate information, all listing information, and demographic data, is provided by third-parties. As such, MyEListing will not be responsible for the accuracy of the information. It is strongly recommended that you verify all information with the listing agent, and any relevant agencies, prior to making any decisions.


