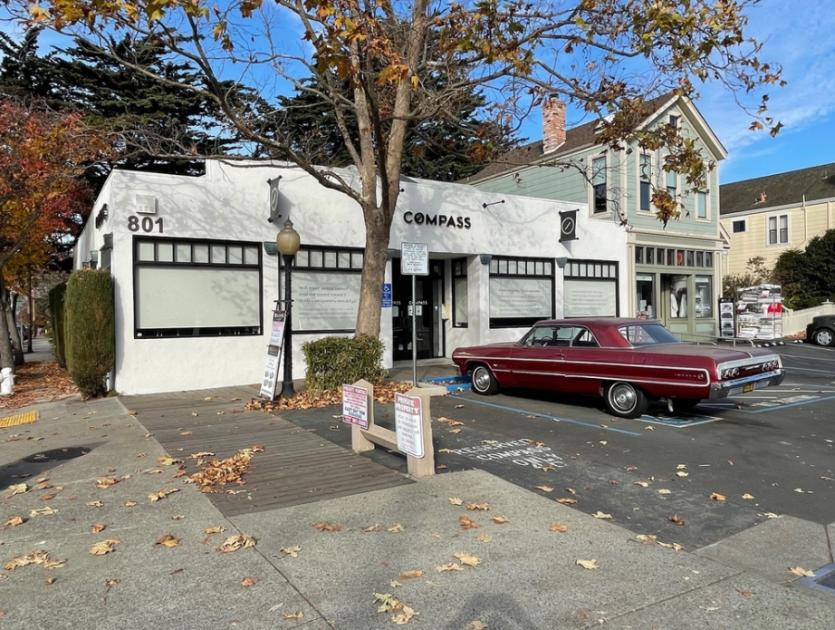
Retail Space
801 Delaware Street Berkeley, CA 94710
801 Delaware Street Berkeley, CA 94710
Details & Description
Property Highlights
• National and publicly traded tenant Compass Real Estate, a leading and innovative real estate firm
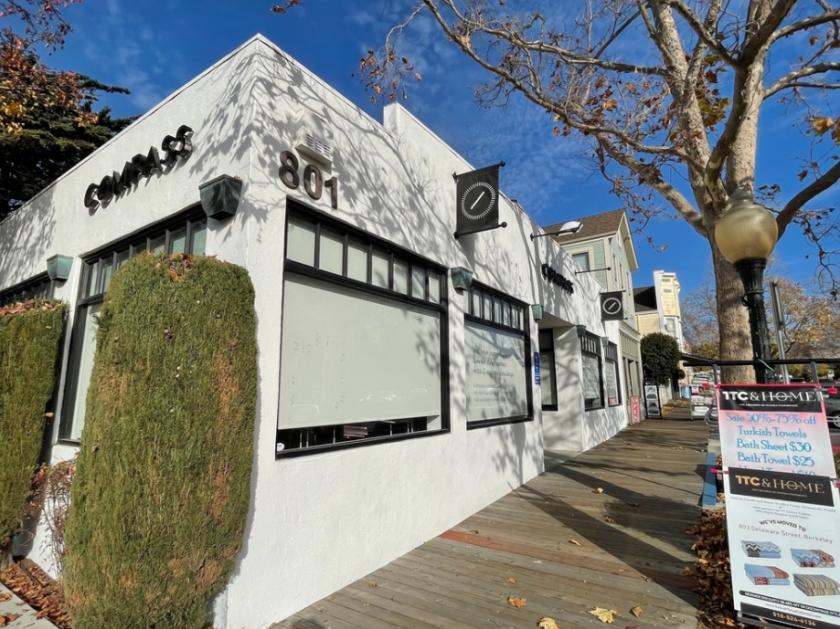
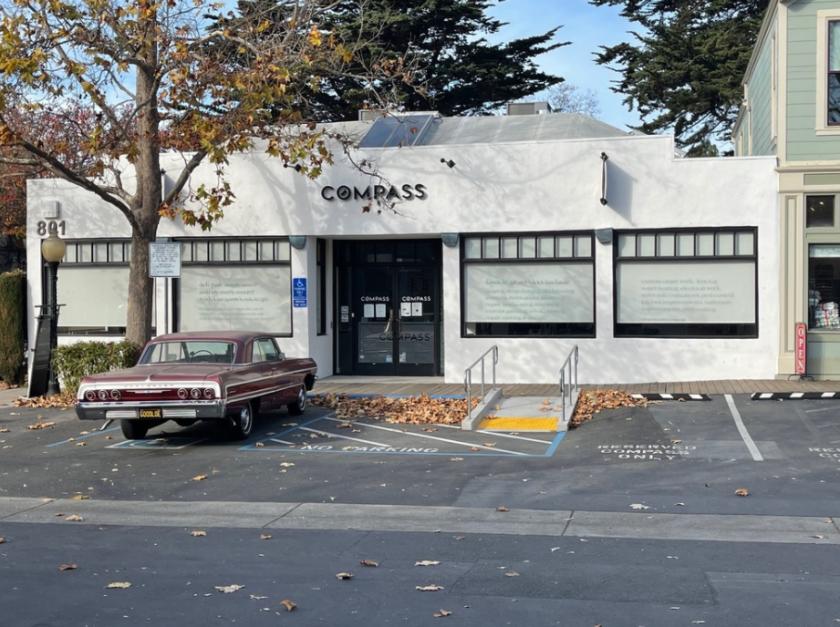
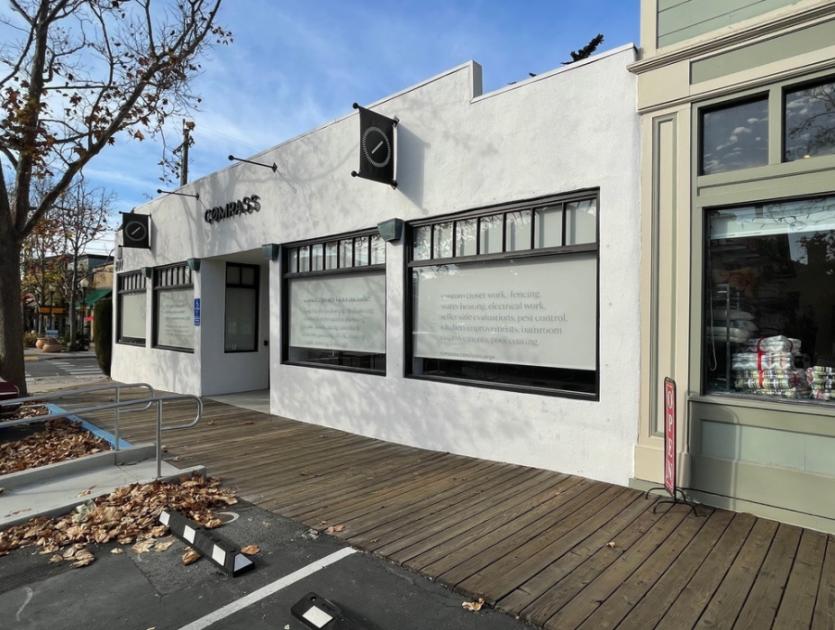
• Rare opportunity with excellent visibility, street appeal, and prime location
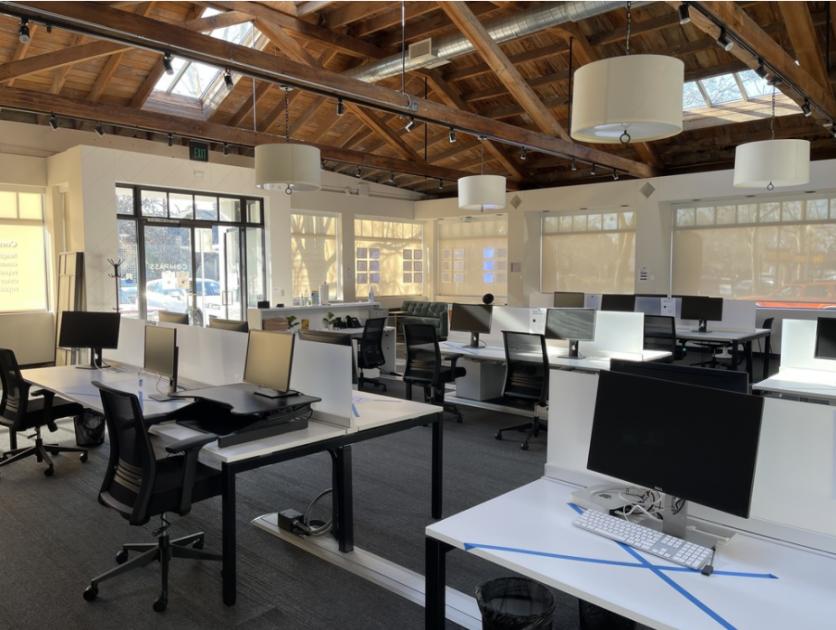
Additional Photos
Listing Agents

Timothy Richardson
O: 510-356-2970
trichardson@nainorcal.com
O: 510-356-2970
trichardson@nainorcal.com

Nick Cole
NAI - Northern California
O: 510-250-7750
ncole@nainorcal.com
NAI - Northern California
O: 510-250-7750
ncole@nainorcal.com
While we strive to provide the most accurate information, all listing information, and demographic data, is provided by third-parties. As such, MyEListing will not be responsible for the accuracy of the information. It is strongly recommended that you verify all information with the listing agent, and any relevant agencies, prior to making any decisions.


