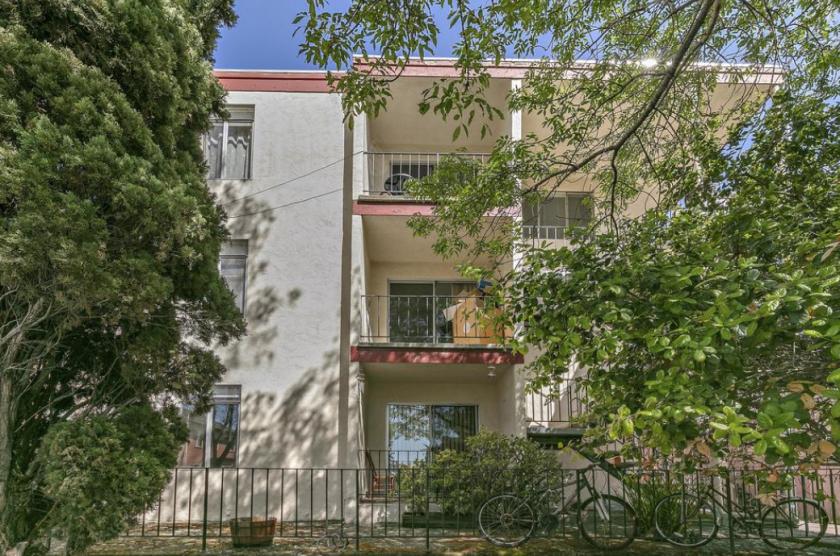
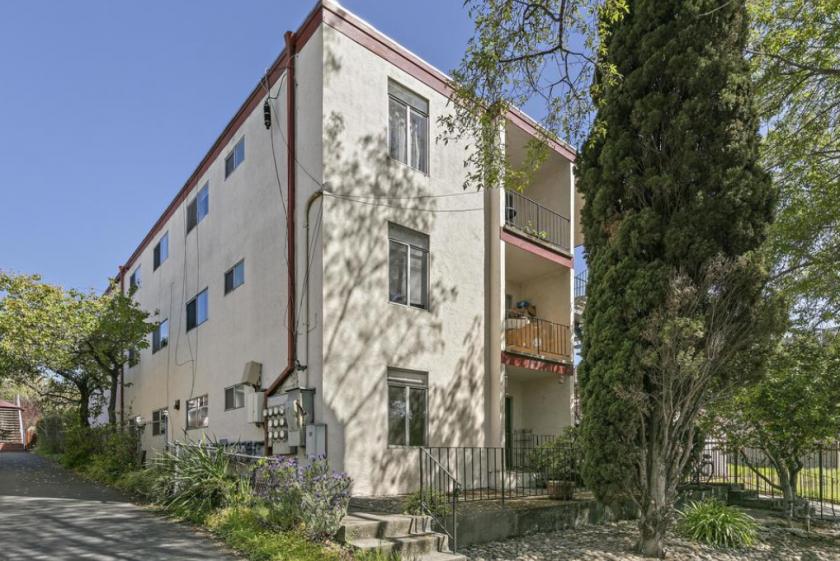
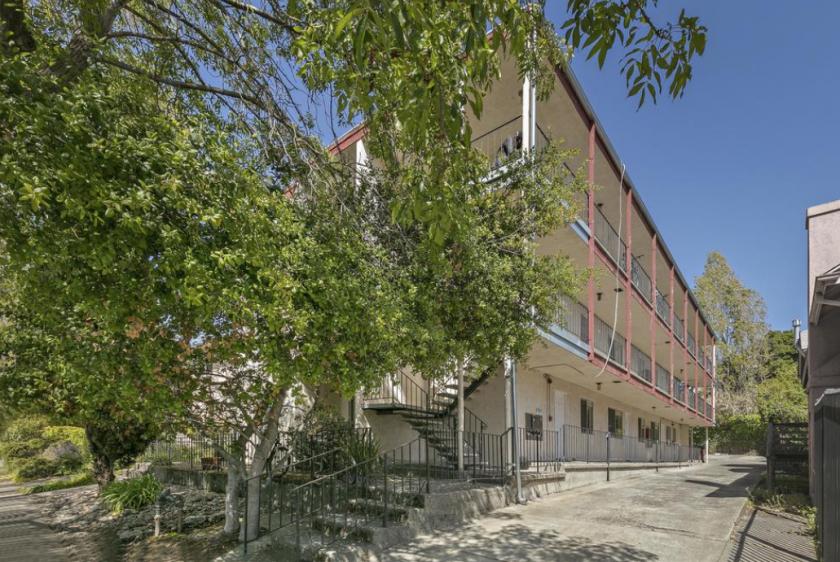
1-Mile | 3-Miles | 5-Miles | ||
---|---|---|---|---|
Total Population | 46,782 | 213,986 | 385,975 | |
Population Median Age | 37 | 38 | 39 | |
Population by Age | 0-9 Yrs | 2832 (6%) | 18234 (8%) | 33796 (8%) |
10-19 Yrs | 5710 (12%) | 25779 (12%) | 38407 (9%) | |
20-29 Yrs | 14041 (30%) | 46421 (21%) | 71871 (18%) | |
30-39 Yrs | 6315 (13%) | 33976 (15%) | 68363 (17%) | |
40-49 Yrs | 4455 (9%) | 26028 (12%) | 49575 (12%) | |
50-59 Yrs | 4327 (9%) | 22418 (10%) | 43458 (11%) | |
60-69 Yrs | 4644 (9%) | 21400 (10%) | 41295 (10%) | |
70+ Yrs | 4459 (9%) | 19731 (9%) | 39209 (10%) | |
Median HH Income | $76,923 | $96,436 | $92,731 | |
Total Household Income | < 24K | 3701 (19%) | 13214 (15%) | 26605 (16%) |
25-49K | 2879 (15%) | 11811 (14%) | 22542 (13%) | |
50-74K | 2604 (13%) | 9699 (11%) | 19268 (11%) | |
75-99K | 1683 (9%) | 8648 (10%) | 17931 (11%) | |
100-199K | 4677 (25%) | 23145 (27%) | 43703 (26%) | |
200K+ | 3082 (16%) | 17762 (21%) | 32219 (19%) | |
Highest Education Level | No Diploma | 829 | 6022 | 16101 |
Diploma or GED | 1475 | 10802 | 25913 | |
Some College | 3297 | 17124 | 37878 | |
Assoc. Degree | 1099 | 7012 | 15715 | |
Bachelors Degree | 10762 | 50166 | 94794 | |
Higher Degree | 12429 | 54991 | 92141 | |
Total Housing Units | 20,035 | 90,122 | 172,804 | |
--Owner-Occupied | 6,983 | 37,876 | 71,142 | |
--Renter-Occupied | 11,642 | 46,403 | 91,127 | |
Owner-Occupied Values | < 100K | 111 | 601 | 1353 |
100-199K | 100 | 391 | 1113 | |
200-299K | 97 | 601 | 2046 | |
300-399K | 162 | 1453 | 4673 | |
400-499K | 187 | 1641 | 5010 | |
500K+ | 6327 | 33189 | 56947 | |
Total Working Age Population | 42,232 | 185,328 | 333,696 | |
In Work Force | 25,980 | 122,173 | 225,427 | |
Not In Work Force | 16,253 | 63,155 | 108,268 | |
Workforce Employed | 24,817 | 116,184 | 214,123 | |
Workforce Unemployed | 1,153 | 5,929 | 11,233 | |
Civlian Workforce | 25,970 | 122,113 | 225,356 | |
Military Workforce | 10 | 60 | 71 | |
Total Households | 18,625 | 84,279 | 162,269 | |
Family Households | 7,796 | 42,549 | 79,313 | |
Non-Family Households | 10,830 | 41,730 | 82,956 | |
Married Couple | 6,256 | 32,865 | 59,786 | |
Other Family | 1,540 | 9,684 | 19,527 | |
Married w/Child | 2,442 | 13,801 | 23,599 | |
Single Male w/Child | 140 | 1,183 | 2,125 | |
Single Female w/Child | 514 | 3,134 | 6,313 |
Population Change Last Two Decades - Plus Projection
2000 | % | 2010 | % | 2020 | % | 2030 | |
---|---|---|---|---|---|---|---|
California | 33,871,648 | +10 | 37,253,956 | +9 | 40,467,295 | +8 | 43,631,295 |
Alameda County | 1,443,741 | +5 | 1,510,271 | +12 | 1,696,752 | +10 | 1,861,027 |
Contra Costa County | 948,816 | +11 | 1,049,025 | +12 | 1,171,305 | +11 | 1,296,786 |
Marin County | 247,289 | +2 | 252,409 | +4 | 263,085 | +2 | 267,912 |
San Francisco County | 776,733 | +4 | 805,235 | +12 | 903,294 | +8 | 976,481 |
Total Working Age Population:
Total Households:
Total Working Age Population:
Total Households:
Total Working Age Population:
Total Households: