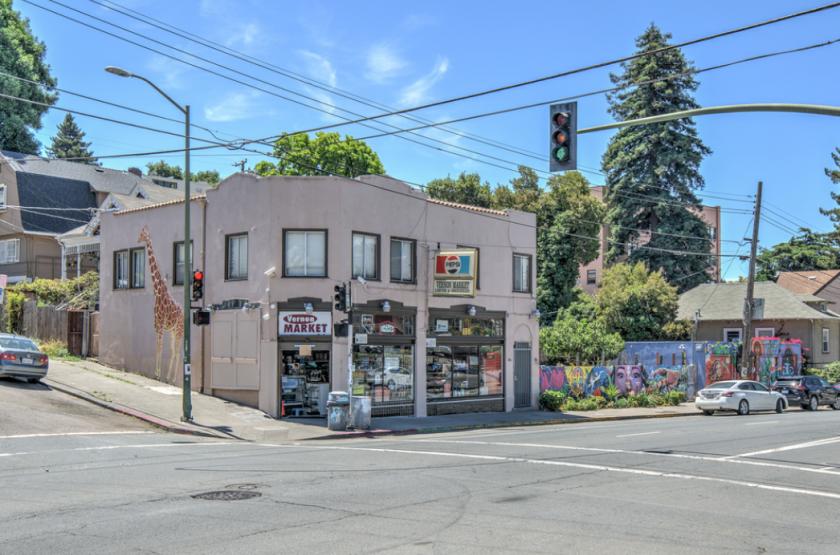
Retail Space
3210 Harrison Street Oakland, CA 94611
3210 Harrison Street Oakland, CA 94611
Details & Description
Property Highlights
- • Separately metered for PGE
- • Detached four-car garage
- • Easy access to Hwy 580
- • 2 spacious 1-bedroom, 1-bathroom units
- • Near Lake Merritt and Downtown Oakland
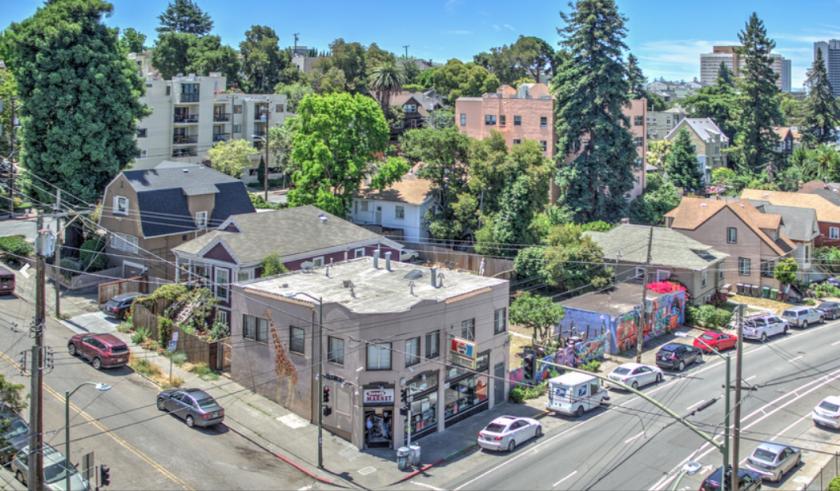
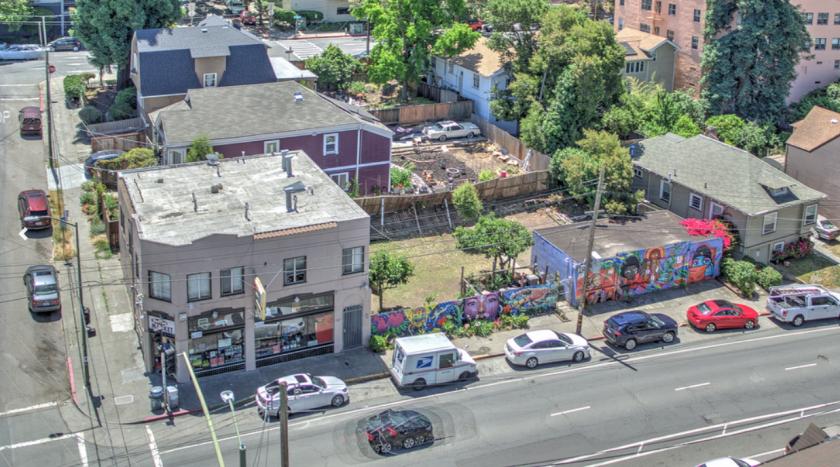
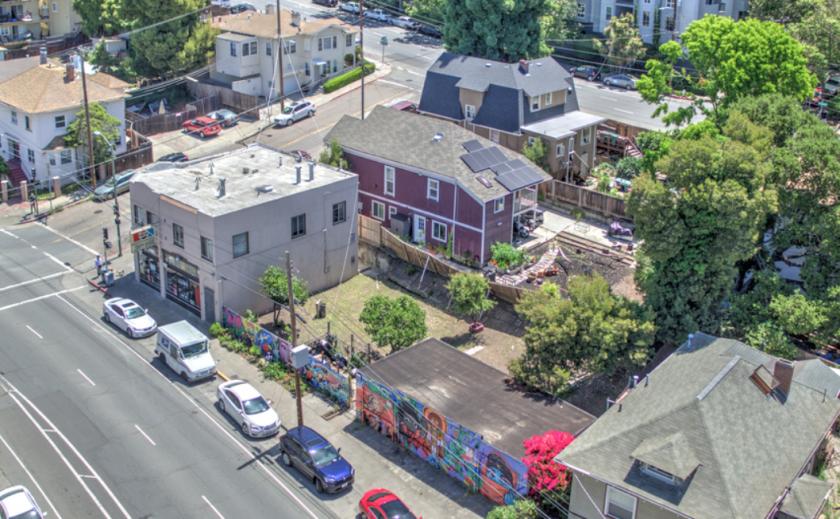
Additional Photos

Listing Agents

Grant Chappell
O: 510-336-4721
M: 415-246-4314
grant@nainorcal.com
O: 510-336-4721
M: 415-246-4314
grant@nainorcal.com
While we strive to provide the most accurate information, all listing information, and demographic data, is provided by third-parties. As such, MyEListing will not be responsible for the accuracy of the information. It is strongly recommended that you verify all information with the listing agent, and any relevant agencies, prior to making any decisions.


