Industrial Properties
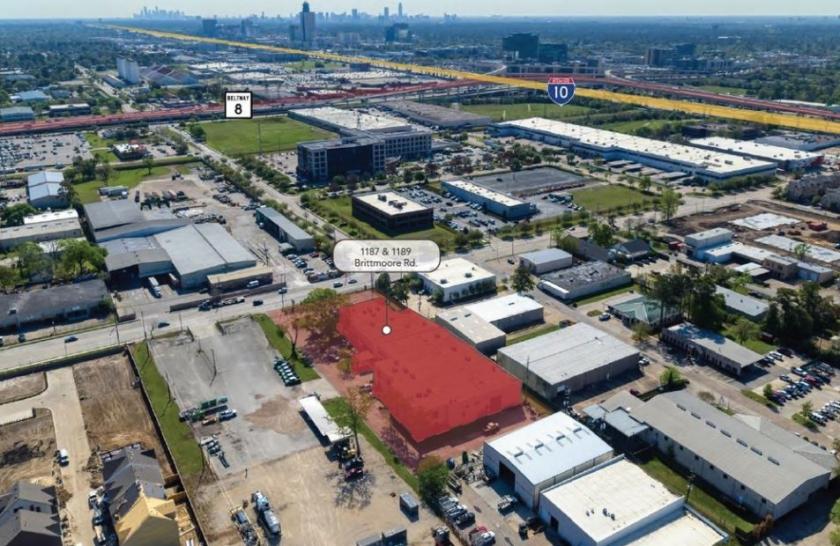
1187 Brittmoore Road Houston, TX 77043
1187 Brittmoore Road Houston, TX 77043
Details & Description
Property Highlights
• 8.00 CAP Rate on Current Income - 1187 Brittmoore offers an attractive CAP rate on a property in an irreplaceable locat
• 30 Months Remaining on Lease - This gives an investor a significant stream of income until September 30, 2023.
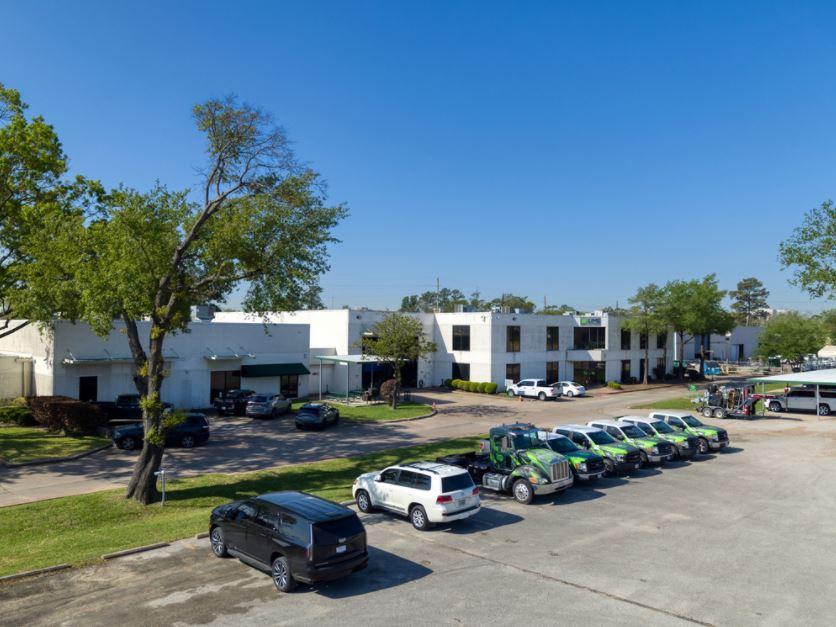
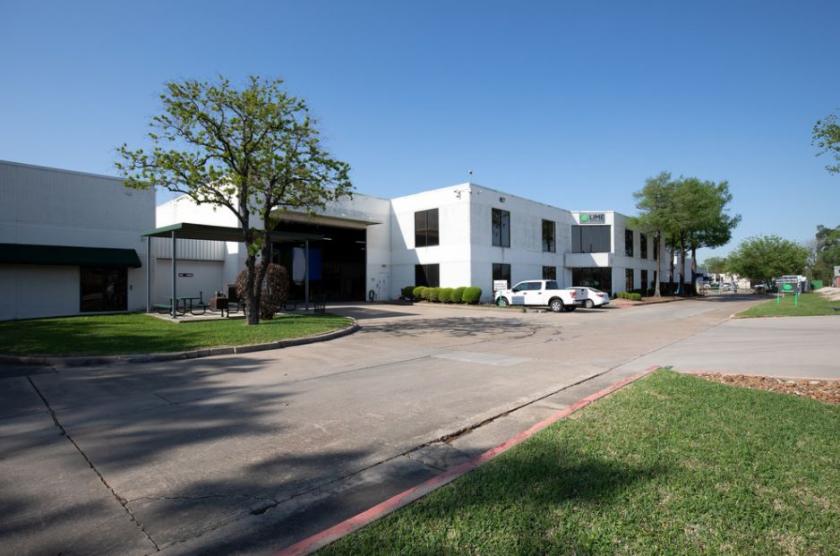
Additional Photos


Listing Agents

Joshua Lass-Sughrue
O: 713-275-9628
jls@partnersrealestate.com
O: 713-275-9628
jls@partnersrealestate.com

Chris Kugle
O: 713-985-4609
chris.kugle@partnersrealestate.com
O: 713-985-4609
chris.kugle@partnersrealestate.com
While we strive to provide the most accurate information, all listing information, and demographic data, is provided by third-parties. As such, MyEListing will not be responsible for the accuracy of the information. It is strongly recommended that you verify all information with the listing agent, and any relevant agencies, prior to making any decisions.


