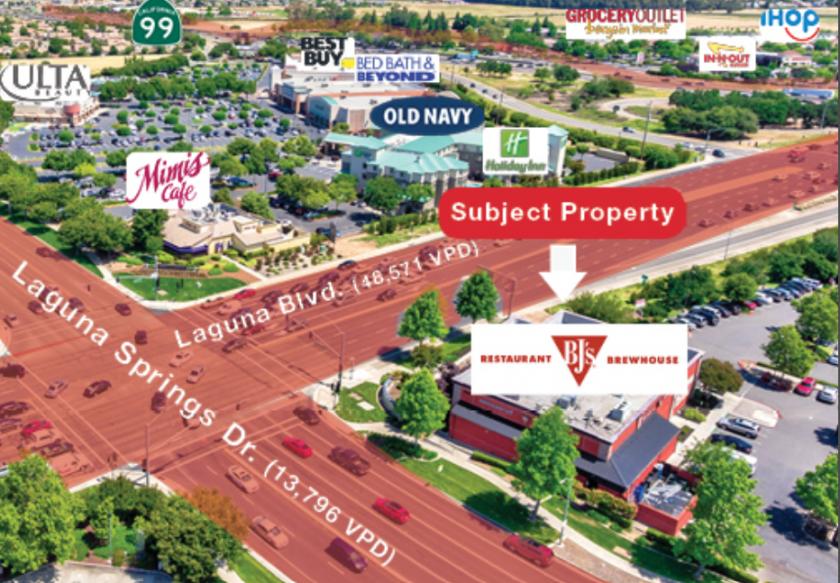
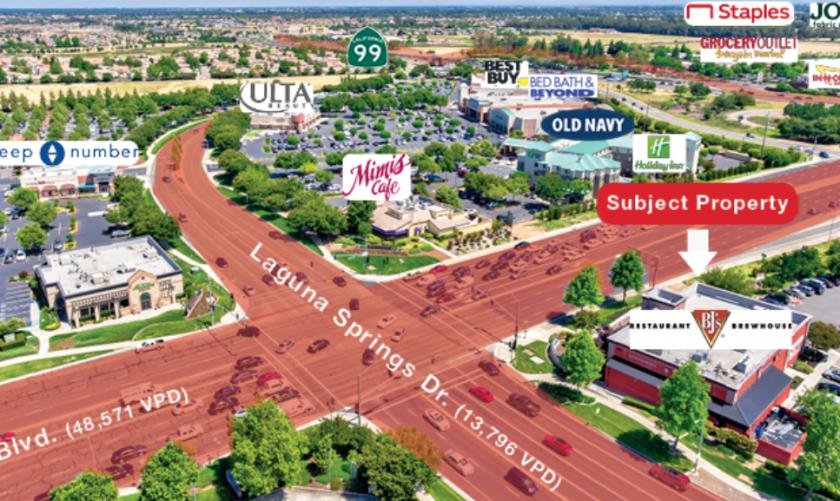
1-Mile | 3-Miles | 5-Miles | ||
---|---|---|---|---|
Total Population | 15,226 | 139,111 | 286,973 | |
Population Median Age | 38 | 37 | 36 | |
Population by Age | 0-9 Yrs | 1855 (12%) | 18240 (13%) | 39666 (13%) |
10-19 Yrs | 2096 (13%) | 20797 (14%) | 43343 (15%) | |
20-29 Yrs | 2040 (13%) | 18347 (13%) | 37735 (13%) | |
30-39 Yrs | 1894 (12%) | 19003 (13%) | 39020 (13%) | |
40-49 Yrs | 2210 (14%) | 19672 (14%) | 38726 (13%) | |
50-59 Yrs | 1896 (12%) | 18287 (13%) | 38501 (13%) | |
60-69 Yrs | 1822 (11%) | 13797 (9%) | 27639 (9%) | |
70+ Yrs | 1413 (9%) | 10967 (7%) | 22344 (7%) | |
Median HH Income | $78,371 | $84,314 | $78,066 | |
Total Household Income | < 24K | 709 (14%) | 5086 (11%) | 12264 (14%) |
25-49K | 804 (16%) | 6230 (14%) | 14647 (16%) | |
50-74K | 892 (17%) | 7499 (17%) | 15087 (17%) | |
75-99K | 765 (15%) | 6795 (15%) | 12386 (14%) | |
100-199K | 1552 (30%) | 13867 (32%) | 26181 (30%) | |
200K+ | 294 (5%) | 3217 (7%) | 6469 (7%) | |
Highest Education Level | No Diploma | 989 | 10818 | 26033 |
Diploma or GED | 2306 | 18057 | 39547 | |
Some College | 2648 | 23716 | 47266 | |
Assoc. Degree | 1195 | 9835 | 19211 | |
Bachelors Degree | 2447 | 20798 | 38177 | |
Higher Degree | 785 | 7647 | 15436 | |
Total Housing Units | 5,159 | 44,007 | 90,106 | |
--Owner-Occupied | 3,348 | 30,113 | 59,012 | |
--Renter-Occupied | 1,668 | 12,583 | 28,022 | |
Owner-Occupied Values | < 100K | 61 | 826 | 2321 |
100-199K | 81 | 917 | 3302 | |
200-299K | 945 | 5743 | 12777 | |
300-399K | 1231 | 11623 | 19089 | |
400-499K | 643 | 6978 | 12452 | |
500K+ | 387 | 4026 | 9071 | |
Total Working Age Population | 12,034 | 108,559 | 221,227 | |
In Work Force | 7,279 | 69,088 | 138,625 | |
Not In Work Force | 4,754 | 39,471 | 82,602 | |
Workforce Employed | 6,660 | 64,390 | 128,797 | |
Workforce Unemployed | 602 | 4,584 | 9,646 | |
Civlian Workforce | 7,262 | 68,973 | 138,443 | |
Military Workforce | 17 | 114 | 182 | |
Total Households | 5,016 | 42,696 | 87,034 | |
Family Households | 3,800 | 33,760 | 68,044 | |
Non-Family Households | 1,217 | 8,936 | 18,990 | |
Married Couple | 2,643 | 24,852 | 48,735 | |
Other Family | 1,157 | 8,908 | 19,309 | |
Married w/Child | 995 | 11,491 | 23,625 | |
Single Male w/Child | 181 | 1,118 | 2,351 | |
Single Female w/Child | 331 | 3,078 | 6,914 |
Population Change Last Two Decades - Plus Projection
2000 | % | 2010 | % | 2020 | % | 2030 | |
---|---|---|---|---|---|---|---|
California | 33,871,648 | +10 | 37,253,956 | +9 | 40,467,295 | +8 | 43,631,295 |
Sacramento County | 1,223,499 | +16 | 1,418,788 | +11 | 1,572,195 | +12 | 1,758,565 |
Total Working Age Population:
Total Households:
Total Working Age Population:
Total Households:
Total Working Age Population:
Total Households: