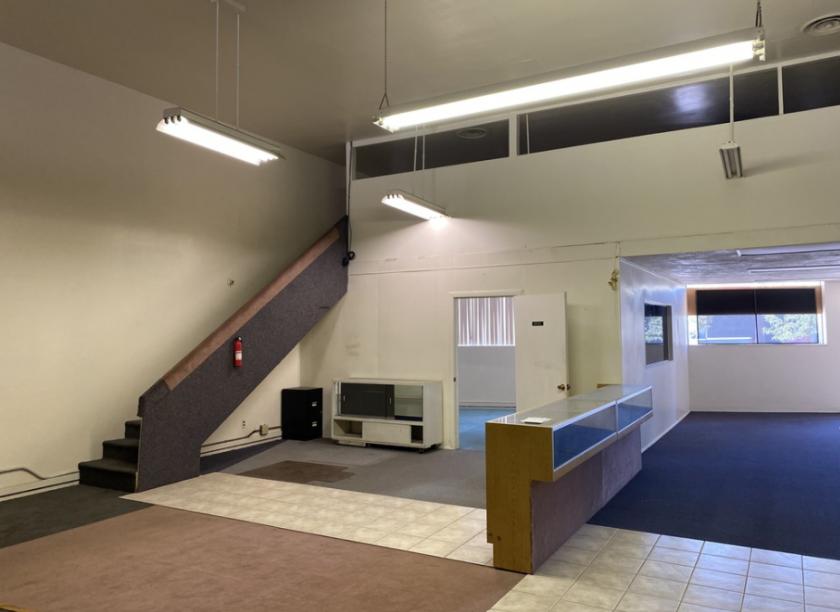
Retail Space
3749 Stockton Boulevard Sacramento, CA 95820
3749 Stockton Boulevard Sacramento, CA 95820

Details & Description
Property Highlights
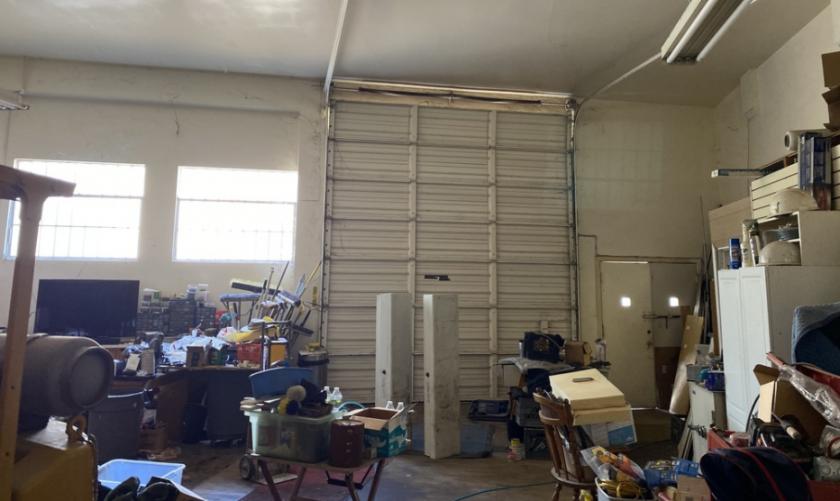
• Value-add opportunity with front officestorefront and back officeloading area available
• Located on Stockton Boulevard, one of the main arteries in the city of Sacramento
Listing Agents

Joshua Ballesteros
O: 415-480-0214
M: 209-518-9025
jballesteros@nainorcal.com
O: 415-480-0214
M: 209-518-9025
jballesteros@nainorcal.com
While we strive to provide the most accurate information, all listing information, and demographic data, is provided by third-parties. As such, MyEListing will not be responsible for the accuracy of the information. It is strongly recommended that you verify all information with the listing agent, and any relevant agencies, prior to making any decisions.