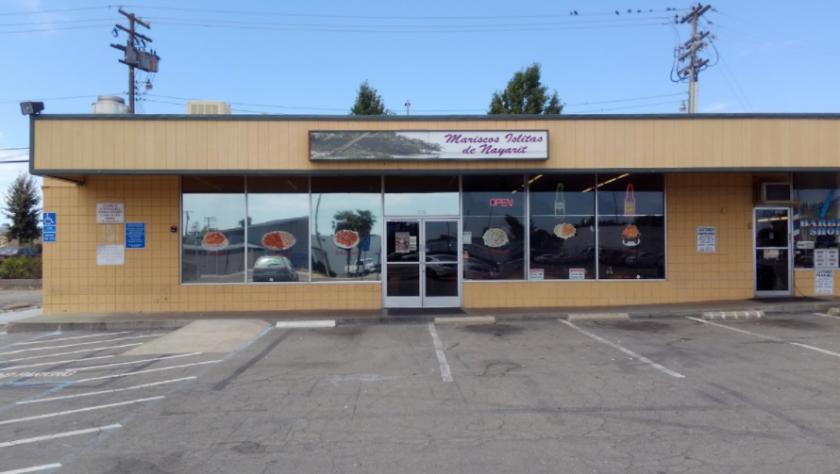
Retail Space
7206 Lindale Drive Sacramento, CA 95828
7206 Lindale Drive Sacramento, CA 95828
Details & Description
Property Highlights
• Perfect opportunity for owner-user or value-add opportunity with one 741 SF unit available for lease
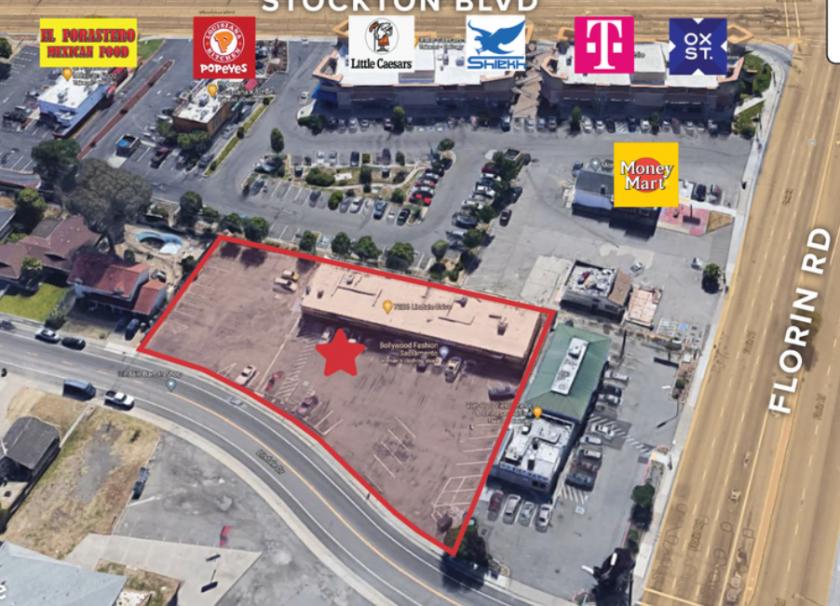
• Centrally located in the midst of high-density residential and high-traffic retail trade corridor
Listing Agents

Joshua Ballesteros
O: 415-480-0214
M: 209-518-9025
jballesteros@nainorcal.com
O: 415-480-0214
M: 209-518-9025
jballesteros@nainorcal.com
While we strive to provide the most accurate information, all listing information, and demographic data, is provided by third-parties. As such, MyEListing will not be responsible for the accuracy of the information. It is strongly recommended that you verify all information with the listing agent, and any relevant agencies, prior to making any decisions.