Commercial Land
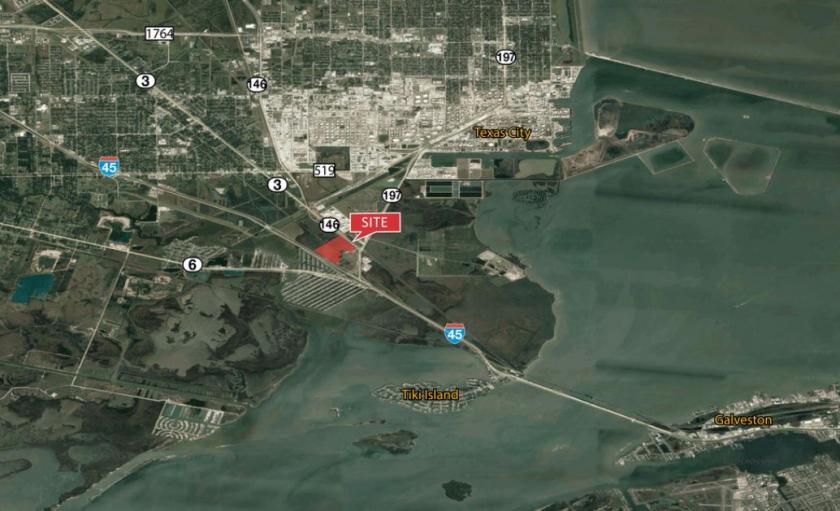
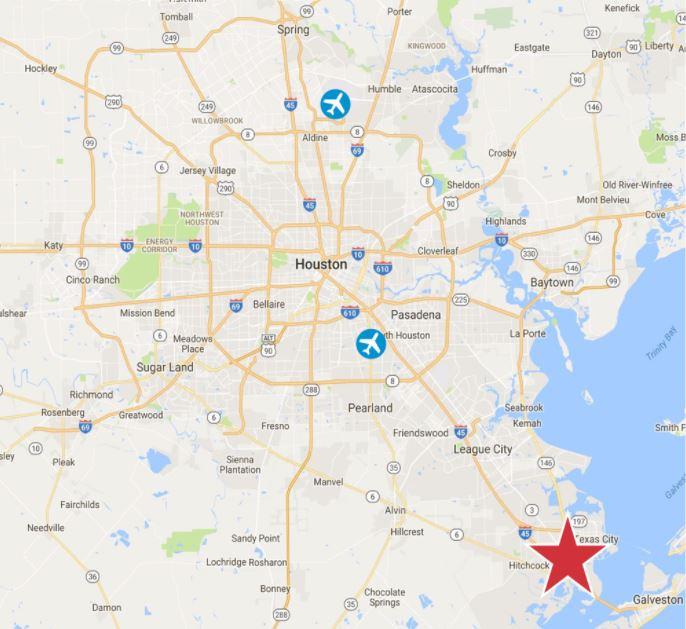
I-45 at Loop 197 La Marque, TX 77568
I-45 at Loop 197 La Marque, TX 77568
Details & Description
Property Highlights
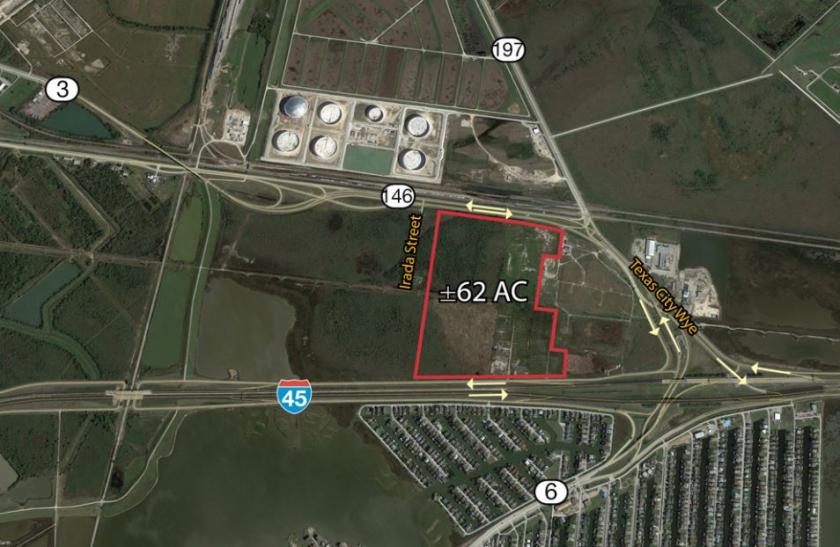
- • 62 Acres of Land Divisible
- • 1714 Frontage on I-45
- • 1450 Frontage on Hwy 146 Hwy 3
- • Galveston County
- • Key Map 738W
- • Sale Price Call Broker
Listing Agents

Griff Bandy
O: 713-985-4411
griff.bandy@partnersrealestate.com
O: 713-985-4411
griff.bandy@partnersrealestate.com

Joe Bright
O: 210-876-2244
joe.bright@partnersrealestate.com
O: 210-876-2244
joe.bright@partnersrealestate.com

Kelly Torian
NAI Partners
O: 713-985-4410
kelly.torian@naipartners.com
NAI Partners
O: 713-985-4410
kelly.torian@naipartners.com
While we strive to provide the most accurate information, all listing information, and demographic data, is provided by third-parties. As such, MyEListing will not be responsible for the accuracy of the information. It is strongly recommended that you verify all information with the listing agent, and any relevant agencies, prior to making any decisions.