Industrial Properties
13700 Luthe Road Houston, TX 77039
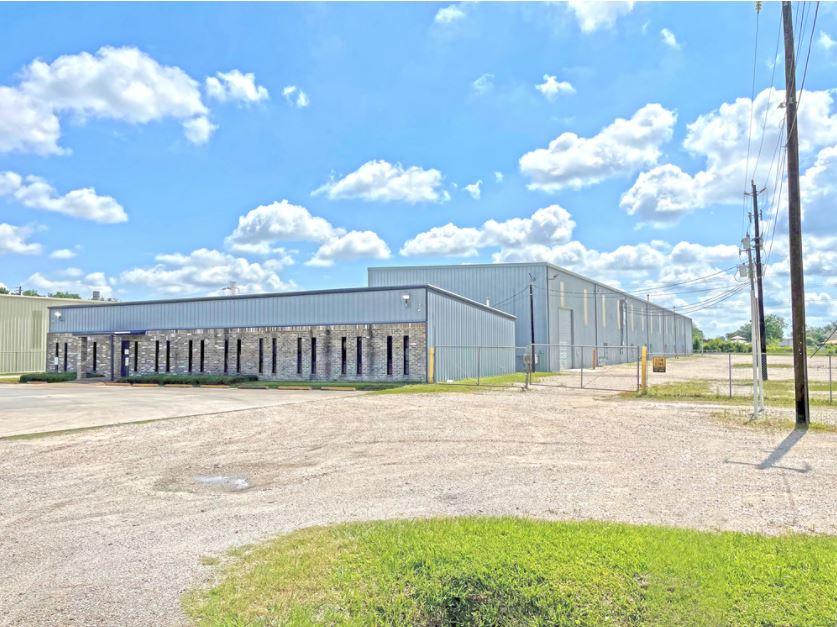
13700 Luthe Road Houston, TX 77039
Details & Description
Property Highlights
- • 17,500 SF Warehouse
- • 3,750 SF Standalone Office
- • 4.37 Acres
- • Freestanding Building
- • Metallic Construction, Recently Painted
- • 3 10-Ton Cranes with 16 Hook Height
Listing Agents

Gray Gilbert
O: 713-301-7252
gray.gilbert@naipartners.com
O: 713-301-7252
gray.gilbert@naipartners.com

Jack Gilbert
NAI Partners
O: 713-275-9657
jack.gilbert@naipartners.com
NAI Partners
O: 713-275-9657
jack.gilbert@naipartners.com
While we strive to provide the most accurate information, all listing information, and demographic data, is provided by third-parties. As such, MyEListing will not be responsible for the accuracy of the information. It is strongly recommended that you verify all information with the listing agent, and any relevant agencies, prior to making any decisions.


