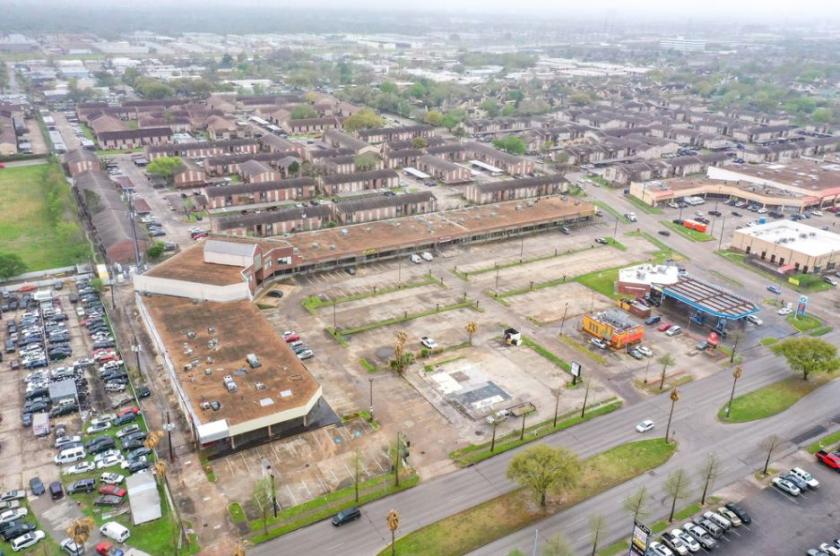
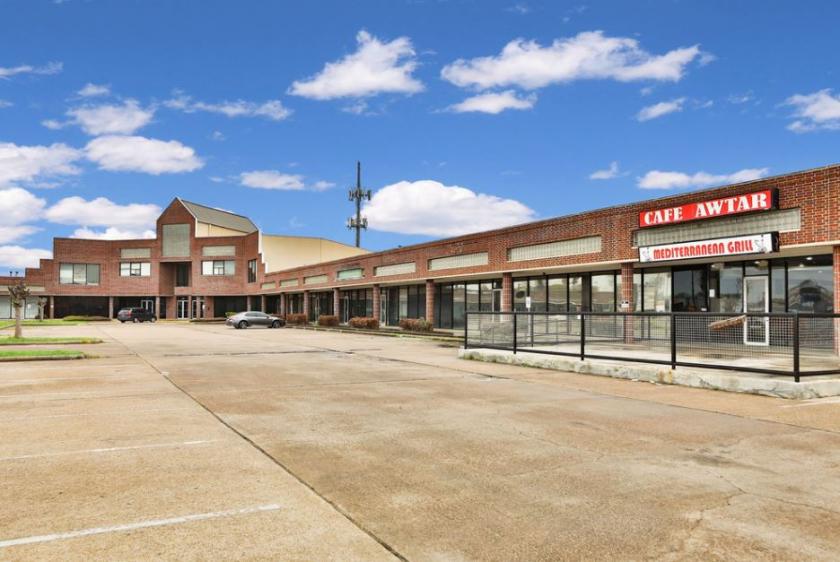
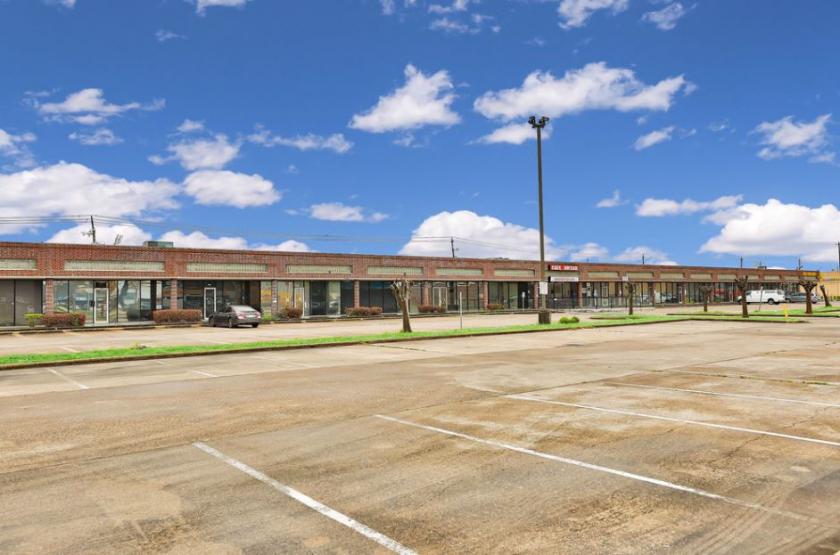
1-Mile | 3-Miles | 5-Miles | ||
---|---|---|---|---|
Total Population | 27,433 | 236,133 | 561,533 | |
Population Median Age | 35 | 34 | 35 | |
Population by Age | 0-9 Yrs | 3872 (14%) | 36727 (15%) | 85019 (15%) |
10-19 Yrs | 2174 (7%) | 27378 (11%) | 68769 (12%) | |
20-29 Yrs | 5624 (20%) | 43589 (18%) | 91144 (16%) | |
30-39 Yrs | 5496 (20%) | 43939 (18%) | 97129 (17%) | |
40-49 Yrs | 3931 (14%) | 30841 (13%) | 74080 (13%) | |
50-59 Yrs | 2747 (10%) | 23267 (9%) | 59824 (10%) | |
60-69 Yrs | 2312 (8%) | 16258 (6%) | 45595 (8%) | |
70+ Yrs | 1277 (4%) | 14134 (5%) | 39972 (7%) | |
Median HH Income | $36,590 | $42,527 | $52,104 | |
Total Household Income | < 24K | 4243 (32%) | 27621 (29%) | 53997 (24%) |
25-49K | 4083 (31%) | 26084 (27%) | 52929 (23%) | |
50-74K | 1926 (14%) | 14822 (15%) | 33590 (15%) | |
75-99K | 1088 (8%) | 8893 (9%) | 20797 (9%) | |
100-199K | 1492 (11%) | 11354 (11%) | 34370 (15%) | |
200K+ | 258 (1%) | 5868 (6%) | 24982 (11%) | |
Highest Education Level | No Diploma | 2964 | 33400 | 69591 |
Diploma or GED | 4104 | 32226 | 69487 | |
Some College | 3306 | 25996 | 59761 | |
Assoc. Degree | 1412 | 8383 | 18557 | |
Bachelors Degree | 5098 | 35323 | 93289 | |
Higher Degree | 2259 | 18764 | 59935 | |
Total Housing Units | 14,652 | 107,443 | 251,780 | |
--Owner-Occupied | 2,568 | 23,518 | 74,751 | |
--Renter-Occupied | 10,523 | 71,125 | 145,913 | |
Owner-Occupied Values | < 100K | 830 | 4260 | 9314 |
100-199K | 811 | 6594 | 16844 | |
200-299K | 603 | 3059 | 10022 | |
300-399K | 163 | 2021 | 8237 | |
400-499K | 38 | 1321 | 4363 | |
500K+ | 122 | 6261 | 25971 | |
Total Working Age Population | 22,274 | 182,250 | 432,704 | |
In Work Force | 16,405 | 128,893 | 302,030 | |
Not In Work Force | 5,869 | 53,357 | 130,673 | |
Workforce Employed | 15,365 | 122,149 | 286,503 | |
Workforce Unemployed | 1,041 | 6,710 | 15,414 | |
Civlian Workforce | 16,405 | 128,859 | 301,917 | |
Military Workforce | 0 | 34 | 113 | |
Total Households | 13,091 | 94,642 | 220,665 | |
Family Households | 6,333 | 52,953 | 132,232 | |
Non-Family Households | 6,758 | 41,689 | 88,433 | |
Married Couple | 3,603 | 32,534 | 87,058 | |
Other Family | 2,730 | 20,420 | 45,173 | |
Married w/Child | 1,714 | 16,047 | 41,635 | |
Single Male w/Child | 456 | 2,658 | 5,417 | |
Single Female w/Child | 1,037 | 8,473 | 20,058 |
Population Change Last Two Decades - Plus Projection
2000 | % | 2010 | % | 2020 | % | 2030 | |
---|---|---|---|---|---|---|---|
Texas | 20,851,820 | +21 | 25,145,561 | +18 | 29,677,668 | +18 | 34,894,452 |
Fort Bend County | 354,452 | +65 | 585,375 | +44 | 840,383 | +43 | 1,203,029 |
Harris County | 3,400,578 | +20 | 4,092,459 | +22 | 4,978,845 | +19 | 5,924,750 |
Total Working Age Population:
Total Households:
Total Working Age Population:
Total Households:
Total Working Age Population:
Total Households: