Commercial Land
4900 West Capitol Avenue West Sacramento, CA 95691
4900 West Capitol Avenue West Sacramento, CA 95691
Details & Description
Property Highlights
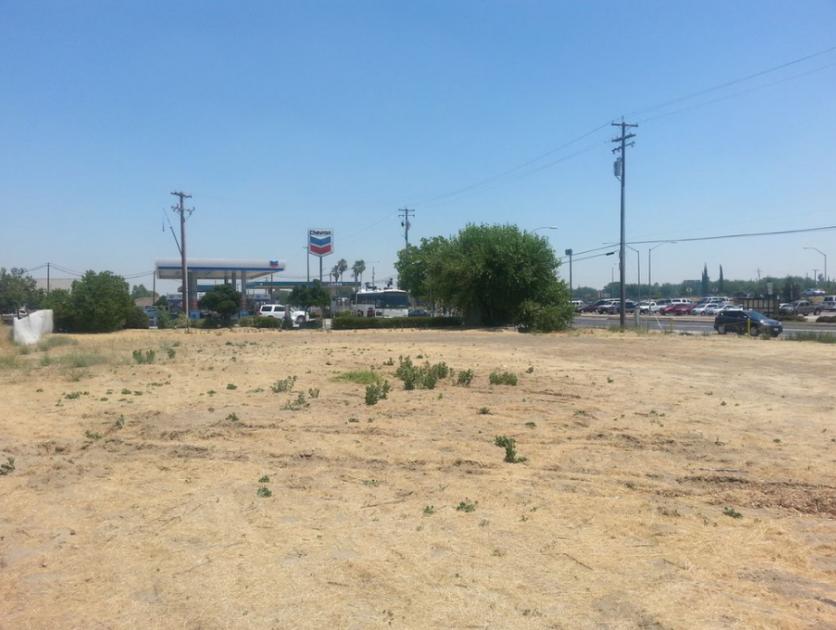
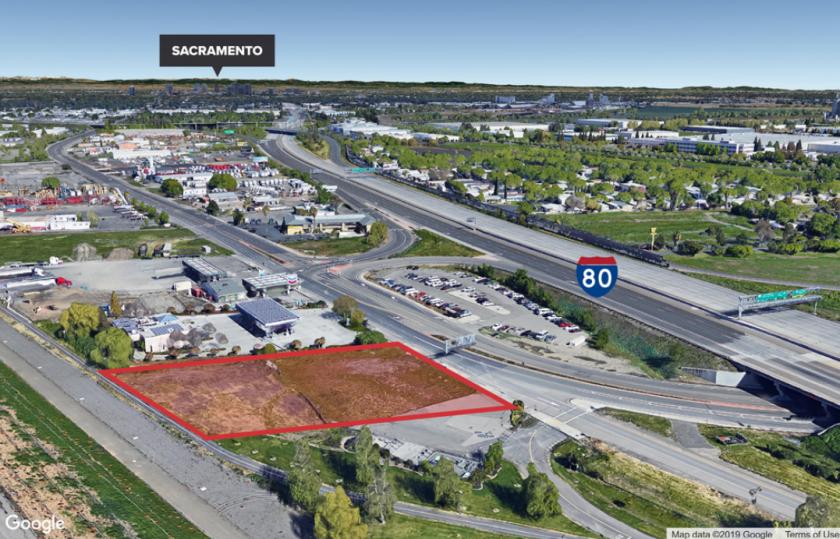
• Conveniently located next to I-80, providing excellent access and visibility from a major highway
• Located on busy W Capitol Ave in West Sacramento, CA
Listing Agents

Alexander Barker
O: 415-480-0209
M: 707-480-2591
abarker@nainorcal.com
O: 415-480-0209
M: 707-480-2591
abarker@nainorcal.com
While we strive to provide the most accurate information, all listing information, and demographic data, is provided by third-parties. As such, MyEListing will not be responsible for the accuracy of the information. It is strongly recommended that you verify all information with the listing agent, and any relevant agencies, prior to making any decisions.