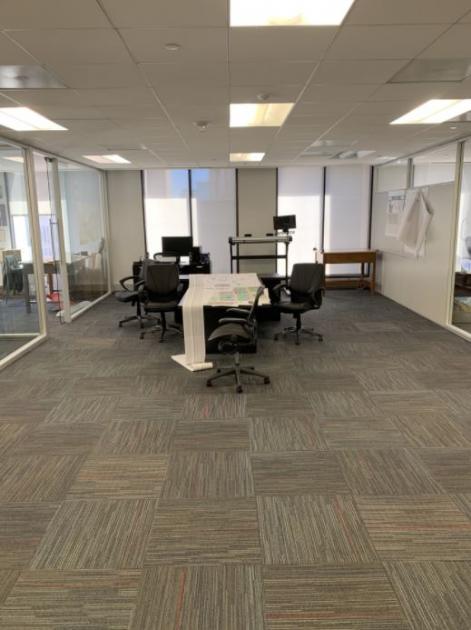
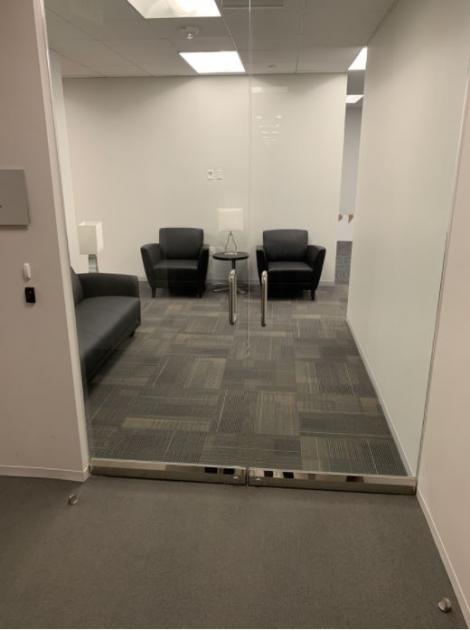
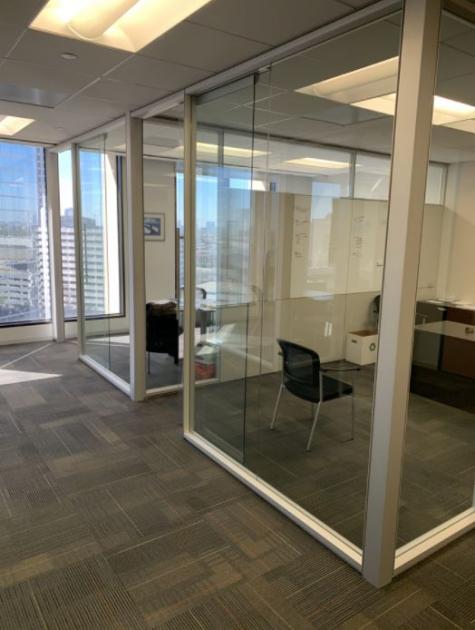
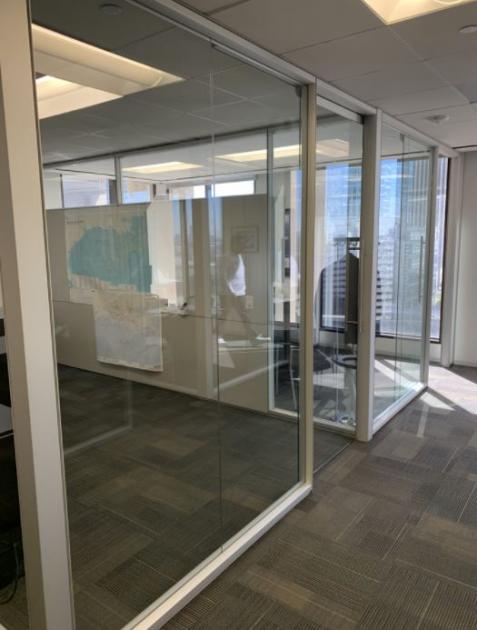
1-Mile | 3-Miles | 5-Miles | ||
---|---|---|---|---|
Total Population | 19,523 | 180,217 | 414,598 | |
Population Median Age | 36 | 37 | 37 | |
Population by Age | 0-9 Yrs | 907 (4%) | 15244 (8%) | 43364 (10%) |
10-19 Yrs | 826 (4%) | 13692 (7%) | 38733 (9%) | |
20-29 Yrs | 6461 (33%) | 43581 (24%) | 88469 (21%) | |
30-39 Yrs | 4675 (23%) | 37765 (20%) | 78297 (18%) | |
40-49 Yrs | 2621 (13%) | 24061 (13%) | 52130 (12%) | |
50-59 Yrs | 2028 (10%) | 19181 (10%) | 46574 (11%) | |
60-69 Yrs | 1326 (6%) | 16950 (9%) | 39493 (9%) | |
70+ Yrs | 679 (3%) | 9741 (5%) | 27539 (6%) | |
Median HH Income | $85,870 | $77,962 | $70,137 | |
Total Household Income | < 24K | 2036 (18%) | 15519 (18%) | 36870 (20%) |
25-49K | 1000 (9%) | 12228 (14%) | 30409 (17%) | |
50-74K | 1721 (15%) | 12277 (14%) | 25669 (14%) | |
75-99K | 1457 (13%) | 8809 (10%) | 17812 (10%) | |
100-199K | 2812 (26%) | 19279 (23%) | 37299 (21%) | |
200K+ | 1755 (16%) | 14024 (17%) | 28863 (16%) | |
Highest Education Level | No Diploma | 803 | 15467 | 43795 |
Diploma or GED | 1659 | 18255 | 46601 | |
Some College | 2103 | 18481 | 40521 | |
Assoc. Degree | 733 | 6144 | 12937 | |
Bachelors Degree | 5983 | 41164 | 81053 | |
Higher Degree | 4108 | 34337 | 69913 | |
Total Housing Units | 12,672 | 95,350 | 204,048 | |
--Owner-Occupied | 2,749 | 32,856 | 78,187 | |
--Renter-Occupied | 8,031 | 49,280 | 98,735 | |
Owner-Occupied Values | < 100K | 122 | 2301 | 12552 |
100-199K | 367 | 4204 | 11672 | |
200-299K | 622 | 4974 | 9544 | |
300-399K | 670 | 6009 | 11444 | |
400-499K | 490 | 4721 | 9174 | |
500K+ | 478 | 10647 | 23801 | |
Total Working Age Population | 18,216 | 158,021 | 350,171 | |
In Work Force | 13,678 | 110,102 | 236,101 | |
Not In Work Force | 4,538 | 47,919 | 114,070 | |
Workforce Employed | 13,209 | 105,230 | 225,118 | |
Workforce Unemployed | 469 | 4,834 | 10,820 | |
Civlian Workforce | 13,678 | 110,064 | 235,938 | |
Military Workforce | 0 | 38 | 163 | |
Total Households | 10,780 | 82,136 | 176,922 | |
Family Households | 2,839 | 33,297 | 85,457 | |
Non-Family Households | 7,941 | 48,839 | 91,465 | |
Married Couple | 1,878 | 23,803 | 60,406 | |
Other Family | 961 | 9,495 | 25,052 | |
Married w/Child | 333 | 7,331 | 21,351 | |
Single Male w/Child | 71 | 806 | 2,240 | |
Single Female w/Child | 445 | 3,547 | 9,092 |
Population Change Last Two Decades - Plus Projection
2000 | % | 2010 | % | 2020 | % | 2030 | |
---|---|---|---|---|---|---|---|
Texas | 20,851,820 | +21 | 25,145,561 | +18 | 29,677,668 | +18 | 34,894,452 |
Fort Bend County | 354,452 | +65 | 585,375 | +44 | 840,383 | +43 | 1,203,029 |
Harris County | 3,400,578 | +20 | 4,092,459 | +22 | 4,978,845 | +19 | 5,924,750 |
Total Working Age Population:
Total Households:
Total Working Age Population:
Total Households:
Total Working Age Population:
Total Households: