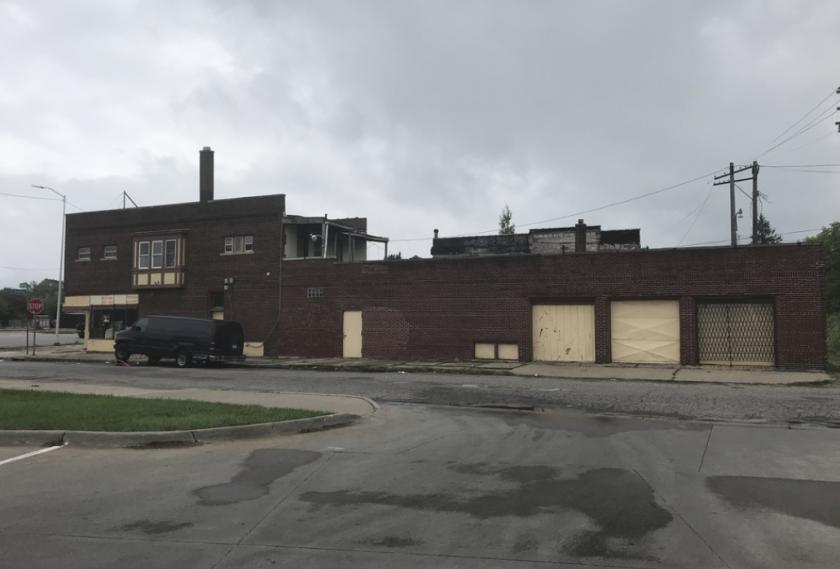
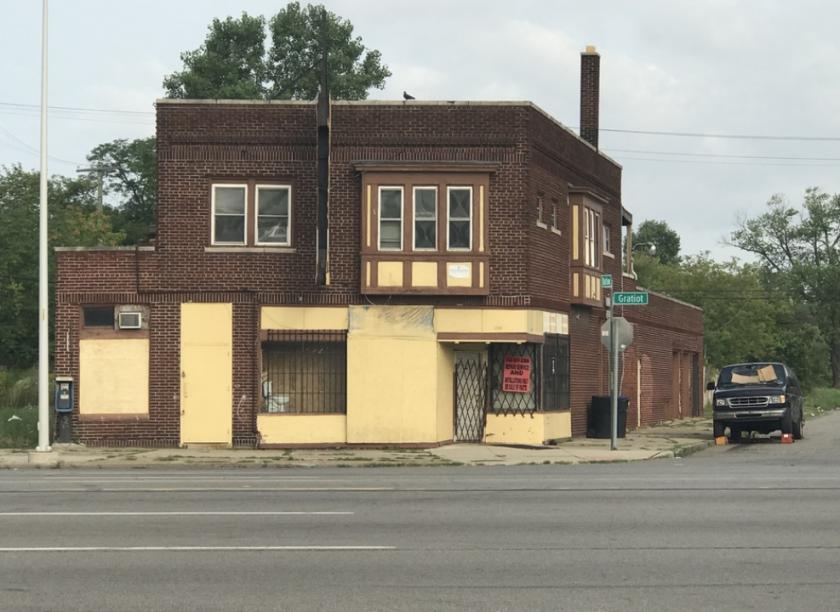
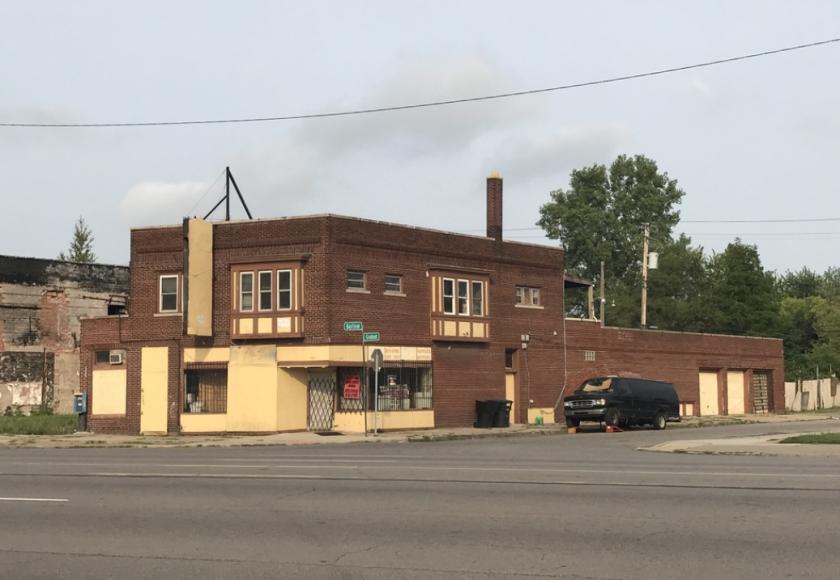
1-Mile | 3-Miles | 5-Miles | ||
---|---|---|---|---|
Total Population | 14,908 | 125,117 | 359,799 | |
Population Median Age | 36 | 34 | 37 | |
Population by Age | 0-9 Yrs | 2063 (13%) | 19628 (15%) | 49083 (13%) |
10-19 Yrs | 1850 (12%) | 16915 (13%) | 48041 (13%) | |
20-29 Yrs | 2714 (18%) | 22752 (18%) | 56054 (15%) | |
30-39 Yrs | 2352 (15%) | 17055 (13%) | 46645 (12%) | |
40-49 Yrs | 1665 (11%) | 14475 (11%) | 43286 (12%) | |
50-59 Yrs | 1776 (11%) | 14886 (11%) | 47017 (13%) | |
60-69 Yrs | 1451 (9%) | 11441 (9%) | 40108 (11%) | |
70+ Yrs | 1037 (6%) | 7964 (6%) | 29565 (8%) | |
Median HH Income | $34,214 | $33,271 | $38,774 | |
Total Household Income | < 24K | 1857 (35%) | 17100 (37%) | 45155 (32%) |
25-49K | 1782 (33%) | 14601 (32%) | 38339 (27%) | |
50-74K | 925 (17%) | 7497 (16%) | 22360 (16%) | |
75-99K | 419 (7%) | 3245 (7%) | 12325 (8%) | |
100-199K | 254 (4%) | 2626 (5%) | 14484 (10%) | |
200K+ | 13 (0%) | 231 (0%) | 4347 (3%) | |
Highest Education Level | No Diploma | 1451 | 14082 | 37750 |
Diploma or GED | 4317 | 30111 | 77304 | |
Some College | 2528 | 21287 | 58744 | |
Assoc. Degree | 1051 | 6923 | 19052 | |
Bachelors Degree | 262 | 3987 | 26252 | |
Higher Degree | 147 | 2066 | 18266 | |
Total Housing Units | 9,053 | 66,031 | 178,384 | |
--Owner-Occupied | 2,455 | 21,412 | 74,474 | |
--Renter-Occupied | 2,795 | 23,888 | 62,536 | |
Owner-Occupied Values | < 100K | 2228 | 19189 | 50308 |
100-199K | 152 | 1611 | 12641 | |
200-299K | 12 | 241 | 4601 | |
300-399K | 10 | 83 | 2718 | |
400-499K | 0 | 33 | 1343 | |
500K+ | 53 | 255 | 2863 | |
Total Working Age Population | 11,668 | 94,891 | 281,089 | |
In Work Force | 7,395 | 56,892 | 162,497 | |
Not In Work Force | 4,273 | 37,999 | 118,592 | |
Workforce Employed | 5,750 | 47,131 | 142,286 | |
Workforce Unemployed | 1,644 | 9,724 | 20,108 | |
Civlian Workforce | 7,395 | 56,855 | 162,394 | |
Military Workforce | 0 | 37 | 103 | |
Total Households | 5,249 | 45,300 | 137,010 | |
Family Households | 3,035 | 26,935 | 80,037 | |
Non-Family Households | 2,215 | 18,365 | 56,972 | |
Married Couple | 779 | 7,729 | 38,352 | |
Other Family | 2,256 | 19,206 | 41,685 | |
Married w/Child | 169 | 2,270 | 14,498 | |
Single Male w/Child | 275 | 1,819 | 4,043 | |
Single Female w/Child | 965 | 8,565 | 17,304 |
Population Change Last Two Decades - Plus Projection
2000 | % | 2010 | % | 2020 | % | 2030 | |
---|---|---|---|---|---|---|---|
Michigan | 9,938,444 | -1 | 9,883,640 | +1 | 10,023,423 | +4 | 10,424,510 |
Macomb County | 788,149 | +7 | 840,978 | +5 | 883,020 | +6 | 933,965 |
Oakland County | 1,194,156 | +1 | 1,202,362 | +5 | 1,264,515 | +7 | 1,350,052 |
St. Clair County | 164,235 | -1 | 163,040 | -3 | 158,894 | 0 | 158,698 |
Wayne County | 2,061,162 | -12 | 1,820,584 | -4 | 1,741,463 | -1 | 1,730,000 |
Total Working Age Population:
Total Households:
Total Working Age Population:
Total Households:
Total Working Age Population:
Total Households: