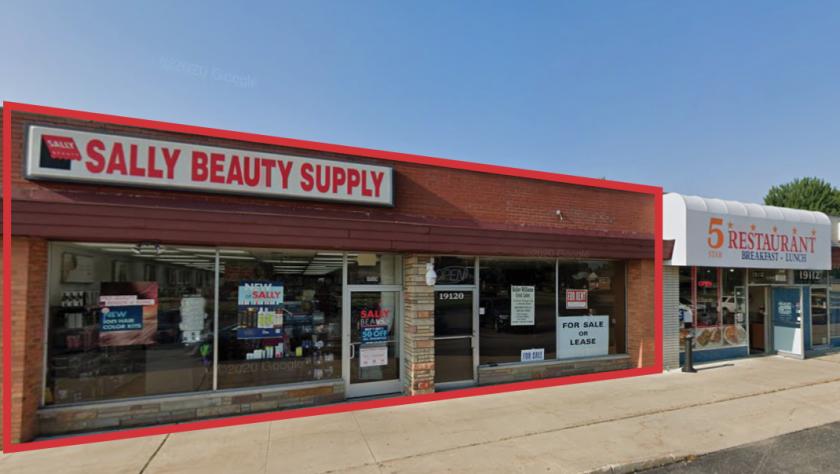
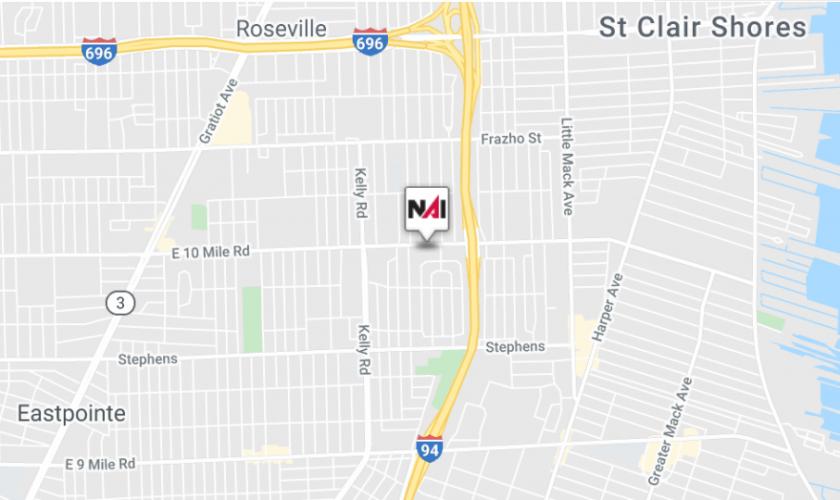
1-Mile | 3-Miles | 5-Miles | ||
---|---|---|---|---|
Total Population | 17,592 | 145,221 | 316,003 | |
Population Median Age | 39 | 40 | 39 | |
Population by Age | 0-9 Yrs | 2020 (11%) | 15667 (10%) | 37445 (11%) |
10-19 Yrs | 2121 (12%) | 16895 (11%) | 37511 (11%) | |
20-29 Yrs | 2470 (14%) | 20500 (14%) | 46126 (14%) | |
30-39 Yrs | 2289 (13%) | 18291 (12%) | 40540 (12%) | |
40-49 Yrs | 2328 (13%) | 18193 (12%) | 39188 (12%) | |
50-59 Yrs | 2632 (14%) | 21361 (14%) | 44788 (14%) | |
60-69 Yrs | 2046 (11%) | 18361 (12%) | 36948 (11%) | |
70+ Yrs | 1686 (9%) | 15953 (10%) | 33457 (10%) | |
Median HH Income | $56,739 | $54,583 | $52,874 | |
Total Household Income | < 24K | 1125 (15%) | 12581 (20%) | 27032 (20%) |
25-49K | 1832 (25%) | 15563 (25%) | 34183 (26%) | |
50-74K | 1925 (26%) | 12763 (20%) | 25874 (20%) | |
75-99K | 1088 (14%) | 8474 (13%) | 16539 (12%) | |
100-199K | 1184 (16%) | 10803 (17%) | 21557 (16%) | |
200K+ | 105 (1%) | 1437 (2%) | 4050 (3%) | |
Highest Education Level | No Diploma | 1221 | 9872 | 22185 |
Diploma or GED | 4331 | 32871 | 71355 | |
Some College | 3523 | 28699 | 59178 | |
Assoc. Degree | 1438 | 10035 | 21524 | |
Bachelors Degree | 1333 | 14972 | 29865 | |
Higher Degree | 651 | 7548 | 16868 | |
Total Housing Units | 7,601 | 65,982 | 143,915 | |
--Owner-Occupied | 5,456 | 43,266 | 86,872 | |
--Renter-Occupied | 1,804 | 18,356 | 42,363 | |
Owner-Occupied Values | < 100K | 2731 | 19270 | 35883 |
100-199K | 2534 | 18773 | 38357 | |
200-299K | 146 | 3203 | 6556 | |
300-399K | 28 | 1207 | 2579 | |
400-499K | 0 | 340 | 1199 | |
500K+ | 18 | 473 | 2298 | |
Total Working Age Population | 14,299 | 118,744 | 254,642 | |
In Work Force | 9,452 | 76,224 | 163,335 | |
Not In Work Force | 4,846 | 42,520 | 91,307 | |
Workforce Employed | 8,816 | 70,805 | 150,670 | |
Workforce Unemployed | 630 | 5,305 | 12,492 | |
Civlian Workforce | 9,446 | 76,110 | 163,162 | |
Military Workforce | 6 | 115 | 173 | |
Total Households | 7,260 | 61,622 | 129,234 | |
Family Households | 4,570 | 36,861 | 79,955 | |
Non-Family Households | 2,690 | 24,761 | 49,279 | |
Married Couple | 2,967 | 23,515 | 48,374 | |
Other Family | 1,603 | 13,346 | 31,581 | |
Married w/Child | 1,071 | 7,858 | 16,443 | |
Single Male w/Child | 210 | 1,520 | 3,397 | |
Single Female w/Child | 580 | 5,098 | 12,700 |
Population Change Last Two Decades - Plus Projection
2000 | % | 2010 | % | 2020 | % | 2030 | |
---|---|---|---|---|---|---|---|
Michigan | 9,938,444 | -1 | 9,883,640 | +1 | 10,023,423 | +4 | 10,424,510 |
Macomb County | 788,149 | +7 | 840,978 | +5 | 883,020 | +6 | 933,965 |
St. Clair County | 164,235 | -1 | 163,040 | -3 | 158,894 | 0 | 158,698 |
Wayne County | 2,061,162 | -12 | 1,820,584 | -4 | 1,741,463 | -1 | 1,730,000 |
Total Working Age Population:
Total Households:
Total Working Age Population:
Total Households:
Total Working Age Population:
Total Households: