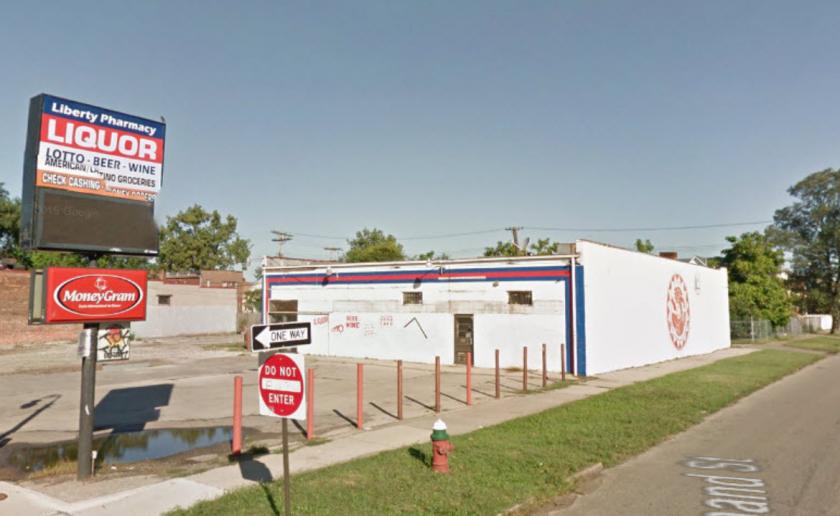
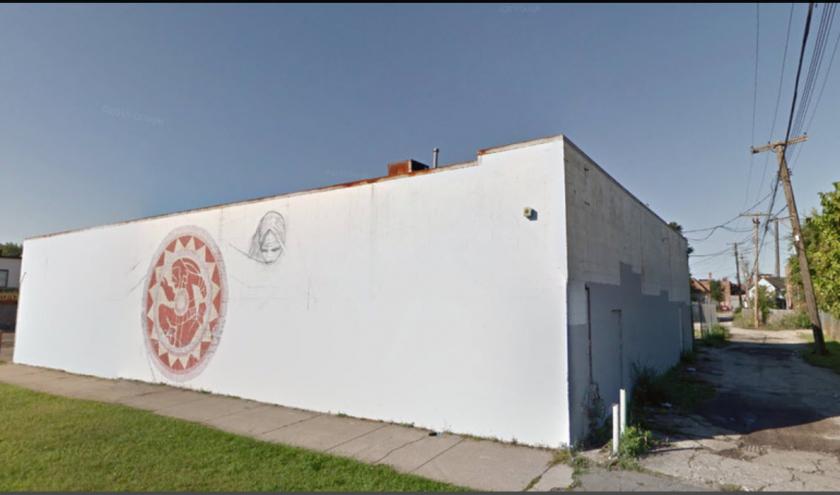
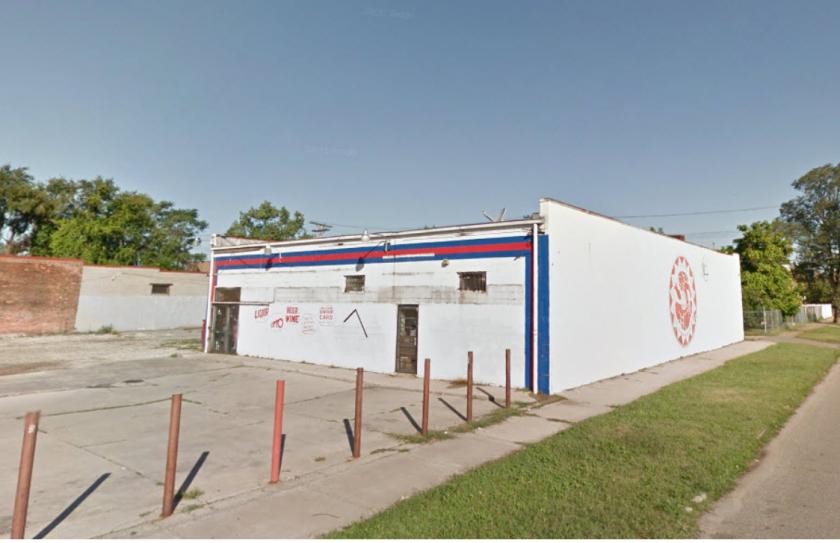
1-Mile | 3-Miles | 5-Miles | ||
---|---|---|---|---|
Total Population | 17,502 | 98,394 | 251,271 | |
Population Median Age | 33 | 33 | 35 | |
Population by Age | 0-9 Yrs | 3449 (19%) | 15826 (16%) | 36450 (14%) |
10-19 Yrs | 2586 (14%) | 14975 (15%) | 36852 (14%) | |
20-29 Yrs | 2306 (13%) | 17759 (18%) | 43770 (17%) | |
30-39 Yrs | 2466 (14%) | 14147 (14%) | 32398 (12%) | |
40-49 Yrs | 2212 (12%) | 10979 (11%) | 28156 (11%) | |
50-59 Yrs | 2189 (12%) | 10491 (10%) | 28647 (11%) | |
60-69 Yrs | 1310 (7%) | 8326 (8%) | 24188 (9%) | |
70+ Yrs | 982 (5%) | 5890 (5%) | 20811 (8%) | |
Median HH Income | $30,953 | $29,215 | $29,284 | |
Total Household Income | < 24K | 2534 (43%) | 16294 (44%) | 43406 (44%) |
25-49K | 1518 (25%) | 9121 (25%) | 24673 (25%) | |
50-74K | 809 (13%) | 5060 (13%) | 13101 (13%) | |
75-99K | 458 (7%) | 2511 (6%) | 6812 (6%) | |
100-199K | 456 (7%) | 2736 (7%) | 7813 (8%) | |
200K+ | 82 (1%) | 756 (2%) | 1688 (1%) | |
Highest Education Level | No Diploma | 3986 | 20381 | 40183 |
Diploma or GED | 2955 | 15533 | 44908 | |
Some College | 1664 | 10223 | 32626 | |
Assoc. Degree | 488 | 2613 | 8788 | |
Bachelors Degree | 729 | 5864 | 17387 | |
Higher Degree | 334 | 4079 | 12562 | |
Total Housing Units | 7,583 | 49,077 | 131,802 | |
--Owner-Occupied | 2,732 | 13,737 | 38,639 | |
--Renter-Occupied | 3,126 | 22,739 | 58,853 | |
Owner-Occupied Values | < 100K | 1971 | 10206 | 25362 |
100-199K | 634 | 1734 | 7691 | |
200-299K | 77 | 936 | 3023 | |
300-399K | 16 | 399 | 1295 | |
400-499K | 26 | 285 | 604 | |
500K+ | 6 | 178 | 665 | |
Total Working Age Population | 12,627 | 73,701 | 193,077 | |
In Work Force | 7,024 | 39,926 | 100,384 | |
Not In Work Force | 5,603 | 33,776 | 92,693 | |
Workforce Employed | 6,215 | 35,283 | 88,020 | |
Workforce Unemployed | 809 | 4,635 | 12,343 | |
Civlian Workforce | 7,024 | 39,918 | 100,363 | |
Military Workforce | 0 | 8 | 21 | |
Total Households | 5,858 | 36,476 | 97,492 | |
Family Households | 3,441 | 17,587 | 47,450 | |
Non-Family Households | 2,417 | 18,889 | 50,043 | |
Married Couple | 2,123 | 9,332 | 23,758 | |
Other Family | 1,318 | 8,256 | 23,691 | |
Married w/Child | 1,254 | 5,200 | 11,930 | |
Single Male w/Child | 263 | 1,013 | 2,005 | |
Single Female w/Child | 491 | 3,700 | 10,106 |
Population Change Last Two Decades - Plus Projection
2000 | % | 2010 | % | 2020 | % | 2030 | |
---|---|---|---|---|---|---|---|
Michigan | 9,938,444 | -1 | 9,883,640 | +1 | 10,023,423 | +4 | 10,424,510 |
Wayne County | 2,061,162 | -12 | 1,820,584 | -4 | 1,741,463 | -1 | 1,730,000 |
Total Working Age Population:
Total Households:
Total Working Age Population:
Total Households:
Total Working Age Population:
Total Households: